
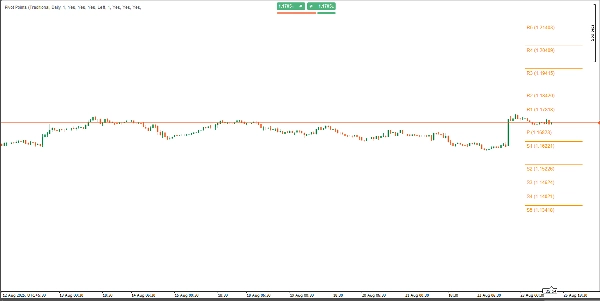
Pivot Point Daily Indicator
Индикатор
14 покупки
Версия 2.0, May 2026
Windows, Mac
4.2
Отзывы: 4
Описание
Основные характеристики:
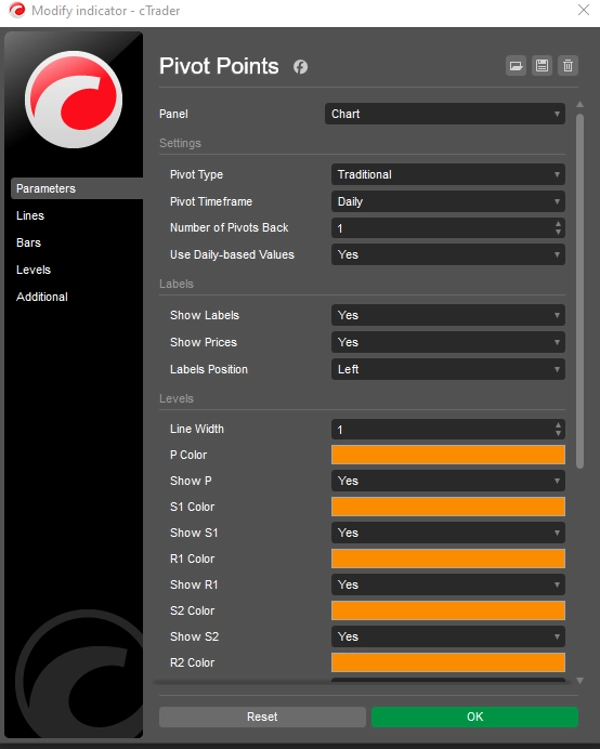
- Несколько стилей Pivot: Бесшовно переключайтесь между шестью методами расчёта Pivot: Классический, Фибоначчи, Вуди, Камарилла, DM и Традиционный. Каждый метод поддерживает различные уровни (до R5/S5 для Традиционного и Камариллы, R3/S3 для Фибоначчи и P/R1/S1 для DM).
- Гибкие таймфреймы: Выбирайте из широкого диапазона таймфреймов Pivot, включая Авто, Дневной, Недельный, Месячный, Квартальный, Годовой и многолетние варианты (Двухлетний, Трёхлетний, Пятилетний, Десятилетний). Идеально подходит для согласования с вашим торговым горизонтом.
- Контроль исторических Pivot: Устанавливайте количество отображаемых исторических наборов Pivot (от 1 до 200) с помощью параметра Number of Pivots Back, обеспечивая чистоту графика при сохранении ключевых исторических уровней.
- Настраиваемый внешний вид: Полностью регулируемые цвета, ширина линий и настройки меток. Включайте или отключайте метки и значения цены, а также выбирайте положение меток (слева или справа) с умными вертикальными смещениями для ясности.
- Данные за день или внутри дня: Возможность использовать значения на основе дневных данных или данных таймфрейма графика, обеспечивая гибкость для различных торговых стратегий.
- Оптимизированная производительность: Лёгкий, нативный код cTrader обеспечивает быстрые обновления в реальном времени без задержек, совместим с Forex, индексами, товарами, криптовалютами и другими рынками.
Почему стоит выбрать Pivot Points Standard?
- Универсальный торговый инструмент: Определяйте ключевые уровни поддержки/сопротивления, направления тренда и возможности прорыва на любом рынке и таймфрейме.
- Удобный интерфейс: Интуитивно понятные выпадающие меню для выбора типа Pivot, таймфрейма и положения меток делают настройку простой.
- Исторический анализ: Визуализируйте до 200 исторических наборов Pivot для изучения прошлых взаимодействий цены и улучшения своей стратегии.
- Чистый график: Умное позиционирование меток и настраиваемая длина линий предотвращают загромождение графика, улучшая читаемость.
Как использовать:
- Примените индикатор к вашему графику cTrader.
- Выберите предпочитаемый тип Pivot (например, Фибоначчи, Камарилла) и таймфрейм Pivot (например, Дневной, Месячный).
- Отрегулируйте параметр Number of Pivots Back для контроля отображаемых исторических наборов.
- Настройте цвета, ширину линий и параметры меток под свой стиль.
- Используйте уровни Pivot для определения поддержки/сопротивления, установки стоп-лосс/тейк-профит или торговли прорывами.
Идеально подходит для:
- Дневных трейдеров: Используйте дневные или недельные Pivot для внутридневных входов и выходов.
- Свинг-трейдеров: Применяйте месячные или квартальные Pivot для захвата долгосрочных трендов.
- Скальперов: Сочетайте с более низкими таймфреймами для быстрых и точных сделок.
- Все рынки: Работает безупречно на Forex, акциях, криптовалютах и товарах.
Повышайте уверенность в торговле
С Pivot Points Standard вы получаете мощный универсальный инструмент, который упрощает технический анализ и улучшает вашу способность выявлять торговые возможности с высокой вероятностью успеха. Независимо от того, новичок вы или опытный трейдер, этот индикатор адаптируется к вашей стратегии, предоставляя чёткие и практичные уровни для повышения эффективности торговли. Попробуйте Pivot Points Standard сегодня и возьмите под контроль свою торговлю с точностью и ясностью! Одноразовая оплата. Пожизненный доступ. Включены будущие обновления.
Сводка
ИИ-сводка
Pivot Point Daily Indicator is a multi-timeframe pivot point tool designed for the cTrader platform. It supports six pivot calculation methods—Classic, Fibonacci, Woodie, Camarilla, DM, and Traditional—each offering various resistance and support levels (up to R5/S5 for some methods). Users can select from a broad range of timeframes including Auto, Daily, Weekly, Monthly, Quarterly, Yearly, and multi-year intervals, allowing alignment with different trading horizons.
The indicator allows displaying up to 200 historical pivot sets to analyze past price interactions while maintaining chart clarity through customizable label positions and line settings. It offers options to use daily-based or intraday data, enhancing flexibility for diverse trading strategies.
Pivot Point Daily Indicator is optimized for real-time performance with native cTrader coding, compatible across Forex, indices, commodities, cryptocurrencies, and other markets. Its interface includes intuitive dropdown menus for pivot type, timeframe, and label customization.
Traders can use this indicator to identify key support and resistance levels, trend directions, and breakout opportunities, aiding in setting stop-loss and take-profit points. It suits various trading styles including day trading, swing trading, and scalping across multiple asset classes.
Профиль индикатора
Категория индикатора
Поддержка и сопротивление
Тип вывода
Фильтр
Требования к данным
Только бары
Поддерживаемые сигналы
Прорыв уровня
Отзывы покупателей
4.2
Отзывы: 4
5 | 25 % | |
4 | 75 % | |
3 | 0 % | |
2 | 0 % | |
1 | 0 % |
Отзывы покупателей
May 2, 2026
Bought it, added it, used it for a while, and now it's disappeared, and I cannot get it back!
August 28, 2025
Good helper for review if the trader wants it keeps attention on levels that actually matter. It works best as support, not a final decision maker. The cleanest use is 3 to 5 levels per chart, with 0.5 pullbacks checked before entry. not every zone holds, even if it looks clean.
August 27, 2025
August 27, 2025
Usable tool with purpose for traders who build plans around market levels. It gives value around key price zones, but not every zone holds, even if it looks clean. I would wait for 2 reactions and avoid trades where the target is less than 1.5R. Levels are useful when they reduce noise, not when they crowd the chart.
Обсуждение
Частые вопросы
Fibonacci
Prop
Forex
Breakout
Indices
Commodities
Продукты, доступные в cTrader Store, включая торговых ботов, индикаторы и плагины, предоставляются сторонними разработчиками и доступны исключительно в информационных и технических целях. cTrader Store не является брокером и не предоставляет инвестиционные консультации, персональные рекомендации или какие-либо гарантии будущей доходности.


Цена
С 30/05/2025
40
Продажи