
BSL_SSL_Liqudity
インジケーター
7 購入済
バージョン 1.0、Aug 2025
Windows、Mac
4.3
レビュー: 3
説明
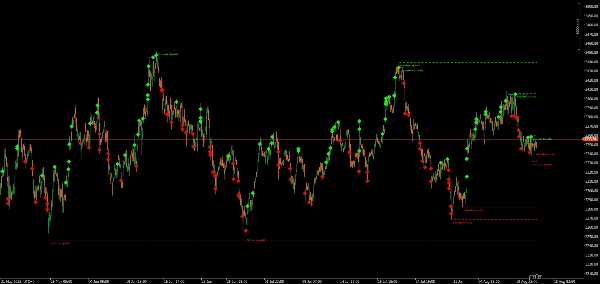
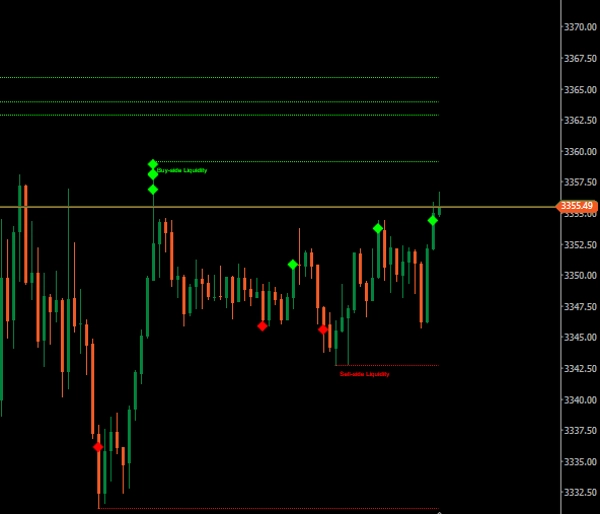
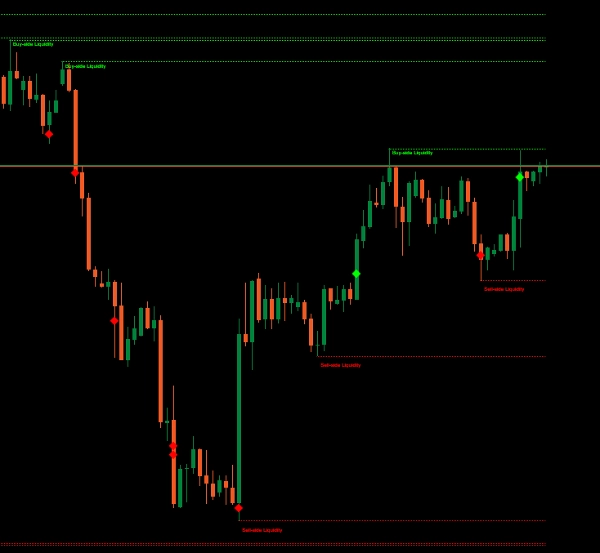
このBuy-Side & Sell-Side Liquidity (BSL/SSL) インジケーターは、(ICT)や流動性ベースの戦略をフォローするトレーダー向けに設計されています。市場の主要な流動性ゾーンを自動的に検出し、スイング高値(買い側流動性)とスイング安値(売り側流動性)を強調表示し、これらのレベルが掃き出されたか、それともそのまま残っているかを監視します。
- BSL (買い側流動性) – ショートポジションのストップロス注文やブレイクアウト買い注文が集まっている可能性のある最近のスイング高値を示します。
- SSL (売り側流動性) – ロングポジションのストップロス注文やブレイクアウト売り注文が存在する可能性のある最近のスイング安値を示します。
- 掃き出しマーカー – 価格がマークされた流動性レベルを突破したとき、インジケーターはダイヤモンドマーカーを表示して掃き出しを示します。
対象者は?
- ICTメソドロジートレーダー
- 流動性獲得 / ストップハント戦略家
- セッションベースの動きを狙うスキャルパー&デイトレーダー
- 高確率の反転ポイントを探すスイングトレーダー
利点
- 視覚的明瞭さ – 市場が流動性を求める可能性のある場所を即座に把握できます。
- 時間効率 – スイングを手動でマークし、掃き出しを確認する手間がなくなります。
- 戦略的優位性 – 以下と組み合わせて使用してください
- FVGs、
- トレードセットアップを洗練するための市場構造。
- セッションキルゾーン
- マクロ
私の他の製品
- Institutional FVG Zones MTF with Confluence
- All-in-One Session Levels Suite
- MARKET_STRUCTURE BOS_CHoCH
- Multi_TF Candlestick Chart Overlay
- ICT Killzones & Macros
- ICT_SMC_ToolKit
- VWAP_MTF
- Traders Dynamic Index (TDI)
- Market_Session_Forex
免責事項: トレーディングにはリスクが伴い、過去の結果は将来のパフォーマンスを保証するものではありません。適切なリスク管理を行い、ストップロスレベルを守り、責任を持って取引してください。これらのアルゴリズムの使用によるいかなる金銭的損失についても私は責任を負いません。これらのインジケーターをコンフルエンスに使用し、チャートのマークアップ時間の負担を軽減してください。
概要
AIによる概要
The Buy-Side & Sell-Side Liquidity (BSL/SSL) Indicator identifies key liquidity zones in the market by marking recent swing highs (Buy-Side Liquidity) and swing lows (Sell-Side Liquidity). It highlights areas where stop-loss orders or breakout orders may cluster and tracks whether these liquidity levels have been breached, displaying diamond markers to indicate sweeps. Designed for traders using ICT methodology, liquidity grab, or stop hunt strategies, it supports scalpers, day traders, and swing traders targeting session-based moves or high-probability reversal points. The indicator provides visual clarity by automatically marking liquidity zones, saving time otherwise spent manually identifying swings and sweeps. It can be combined with other tools such as Fair Value Gaps (FVGs), market structure analysis, and session kill zones to refine trade setups. Supported markets include Forex, indices, commodities, and popular symbols like BTCUSD, EURUSD, XAUUSD, and NAS100. The indicator aims to enhance strategic decision-making by clearly displaying where the market is likely to seek liquidity.
インジケーターのプロフィール
カスタマーレビュー
4.3
レビュー: 3
5 | 33 % | |
4 | 67 % | |
3 | 0 % | |
2 | 0 % | |
1 | 0 % |
カスタマーレビュー
August 16, 2025
Practical account helper around smart money style analysis. The useful part is mapping zones before entries, with the numbers checked before scaling. A good sample is 20 FVG or order block reactions, with messy 0.705 areas skipped. The zone is more convincing when structure and risk both make sense.
August 15, 2025
August 15, 2025
Clean trading note if the trader wants it adds structure around liquidity, gaps and market shifts. It works best as support, not a final decision maker. For SMC logic, I trust zones more when 0.5 mitigation, BOS and liquidity sweep line up. zones still need manual validation.
ディスカッション
よくあるご質問
BTCUSD
Forex
Indices
EURUSD
Commodities
XAUUSD
NAS100
cTrader Storeで入手可能な取引ボット、インジケーター、プラグインなどの商品は、第三者の開発者が提供するものであり、情報と技術の取得のみを目的としてご利用いただけます。cTrader Storeはブローカーではなく、投資助言や個人的な推奨を行うことも、将来のパフォーマンスを保証することもありません。
この作成者の他の商品


価格
登録日 22/06/2025
80
販売
84
無料インストール