
Descripción
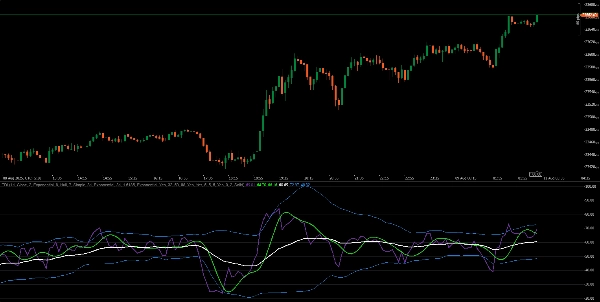
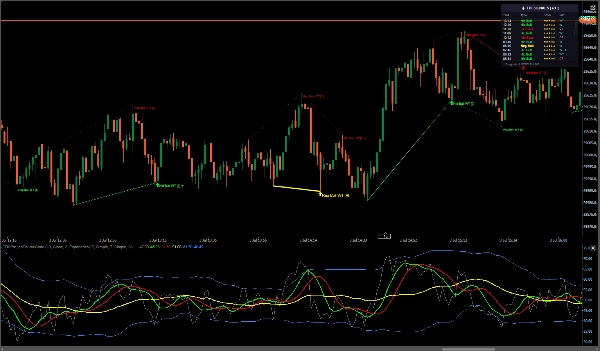
Un TDI profesional - combina RSI, suavizado de media móvil y Bandas de Bollinger con detección automática de divergencias Regulares y Ocultas. Dibuja líneas de divergencia en el panel TDI y (opcionalmente) en el gráfico de precios para un contexto claro como el cristal.
El motor de divergencia omite barras en vivo y valida pivotes solo después de la confirmación completa. El filtrado del estado del mercado suprime señales de baja calidad durante condiciones de rango, mientras que la puntuación de fuerza clasifica cada configuración usando múltiples factores de confluencia, incluyendo extremos de Bandas de Bollinger, alineación de tendencia, pendiente de la Línea Base del Mercado, calidad del pivote y proximidad del cruce TDI.
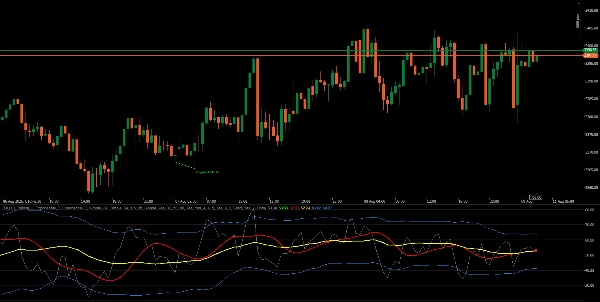
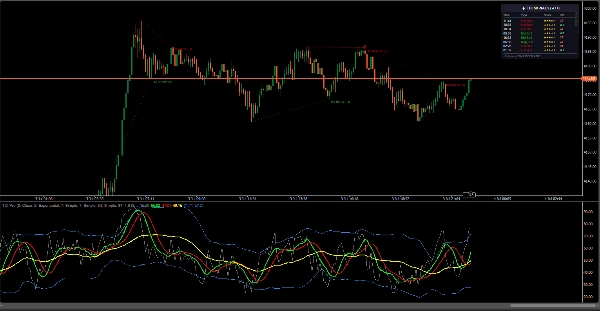
- Suite completa de TDI: Línea de Precio (verde), Línea de Señal (roja), Línea Base del Mercado (amarilla), bandas RSI.
- Bandas de Volatilidad: Bandas de Bollinger aplicadas al RSI (periodo y desviaciones configurables).
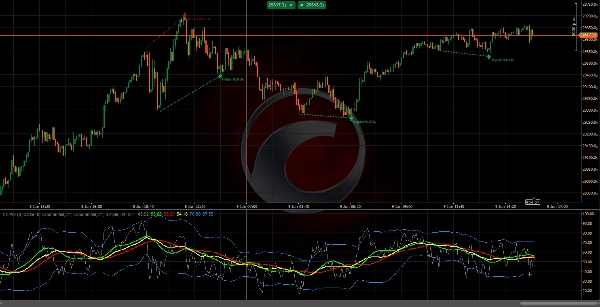
- Motor de divergencia: Detecta Regulares (reversión) y Ocultas (continuación de tendencia) divergencias.
- Visuales en el gráfico: Opción para dibujar líneas/etiquetas de divergencia directamente en el gráfico de precios.
- Pivotes de precisión: Pivotes de oscilación controlados por el usuario (barras Izquierda/Derecha) + espaciamiento mínimo entre barras.
Características clave
- Arquitectura sin repintado
- Filtro de estado del mercado
- Confluencia de Bandas de Bollinger ★
- Puntuación de fuerza (1–5)
- Prioridad visual de señales
- Alineación de tendencia (WT / CT)
Registro de cambios
- v1.0 – Lanzamiento inicial: TDI completo + detección de divergencias Regulares/Ocultas, dibujo en gráfico, niveles guía, controles de estilo avanzados.
Mis otros productos
- Zonas Institucionales FVG MTF con Confluencia
- Suite Completa de Niveles de Sesión
- MARKET_STRUCTURE BOS_CHoCH
- Superposición de Gráfico de Velas Multi_TF
- ICT Killzones & Macros
- ICT_SMC_ToolKit
- VWAP_MTF
- Índice Dinámico de Traders (TDI)
- Market_Session_Forex
Descargo de responsabilidad: El trading implica riesgos y los resultados pasados no garantizan rendimientos futuros. Use una gestión adecuada del riesgo, siga los niveles de stop-loss y opere responsablemente. No soy responsable de pérdidas financieras derivadas del uso de estos algoritmos. use estos indicadores para su confluencia y reduzca la carga de su tiempo de marcado en gráficos
Resumen
The indicator employs a no-repaint architecture and validates swing pivots only after full confirmation, skipping live bars to ensure signal reliability. It includes a Market State Filter to suppress low-quality signals during ranging markets and a Strength Scoring system (1–5) that ranks setups based on multiple confluence factors such as Bollinger Band extremes, trend alignment, Market Base Line slope, pivot quality, and proximity of TDI crosses.
Key components of the full TDI suite include the Price Line (green), Signal Line (red), Market Base Line (yellow), and RSI bands. Users can control precision pivots with adjustable swing pivot parameters and minimum bar spacing. Visual signal priority and trend alignment features support clearer interpretation of market conditions. The indicator supports multiple symbols including BTCUSD, EURUSD, and GBPUSD, and is designed for use with bar and tick data.
Valoraciones de clientes
5 | 67 % | |
4 | 0 % | |
3 | 33 % | |
2 | 0 % | |
1 | 0 % |


