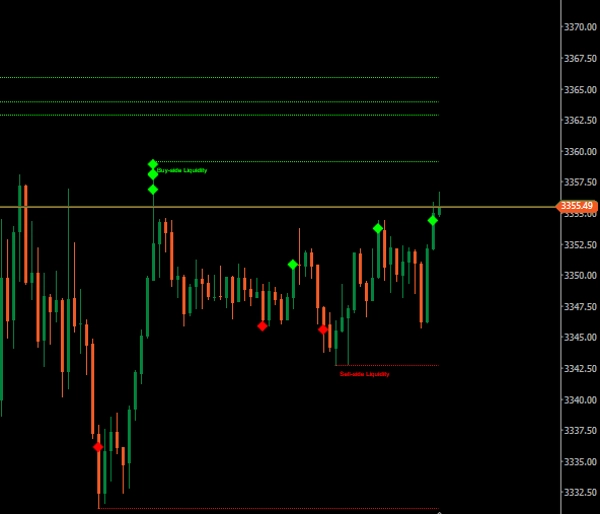
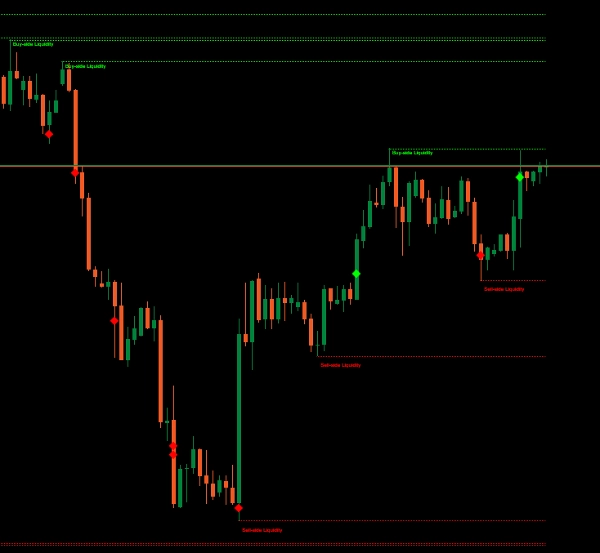
Indicador
NAS100
Indices
XAUUSD
Commodities
Forex
EURUSD
BTCUSD
BSL_SSL_Liqudity
Logotipo de "BSL_SSL_Liqudity"
02/11/2025
3
Desktop
Imagen cargada de "BSL_SSL_Liqudity"Imagen cargada de "BSL_SSL_Liqudity"Imagen cargada de "BSL_SSL_Liqudity"

The Buy-Side & Sell-Side Liquidity (BSL/SSL) Indicator is designed for traders who follow (ICT) or liquidity-based strategies. It automatically detects key liquidity zones in the market—highlighting swing highs (Buy-Side Liquidity) and swing lows (Sell-Side Liquidity)—and monitors whether these levels have been swept or remain intact.

  1. BSL (Buy-Side Liquidity) – Marks recent swing highs where stop-loss orders from short positions or breakout buy orders may be clustered.
  2. SSL (Sell-Side Liquidity) – Marks recent swing lows where stop-loss orders from long positions or breakout sell orders may be sitting.
  3. Swept Markers – When price breaches a marked liquidity level, the indicator plots a diamond marker to show the sweep.

Who Is It For?

  • ICT Methodology Traders
  • Liquidity Grab / Stop Hunt Strategists
  • Scalpers & Day Traders targeting session-based moves
  • Swing Traders looking for high-probability reversal points

Benefits

  • Visual clarity – Instantly see where the market is likely to seek liquidity.
  • Time efficiency – No more manually marking swings and checking for sweeps.


  • Strategic advantage – Combine with
  • FVGs,
  • market structure to refine trade setups.
  • Session kill zones
  • macros


My Other Products


Disclaimer: Trading involves risk, and past results do not guarantee future performance. Use proper risk management, follow stop-loss levels, and trade responsibly. I am not liable for any financial losses from using these algorithms.use these indicators for your confluence and reduce burden your charting markup time

0.0
Valoraciones: 0
Valoraciones de clientes
Este producto todavía no se ha valorado. ¿Ya lo ha probado? Sea el primero en informar a otros.
Más de este autor
Tiny_Aim_Trainer
trading stress-relief “mini-game”
Indicador
NAS100
XAUUSD
Commodities
+10
MARKET_STRUCTURE BOS_CHoCH
MarketStructurePro – Smart BOS/CHoCH
Retro_Shooting_Game
trading stress-relief “mini-game”
Indicador
Indices
Commodities
Forex
Institutional FVG Zones MTF with Confluence
Professional Fair Value Gaps with multitimeframe spot on
Indicador
NAS100
Breakout
XAUUSD
+12
VWAP & Sessions & D,W,M HLO Levels
Killzone Session With VWAP – Precision Meets Price Action
Indicador
NAS100
XAUUSD
FVG
+11
Fair Value Gaps_FVG_MTF
Multi-TF FVG + Smart Fibonacci
Market_Session_Forex
Market Sessions
Indicador
NAS100
Indices
Breakout
+6
All-in-One Session Levels Suite
Institutional Session Levels Pro OHLC,Prev(D,W,M OHLC)
Indicador
NAS100
NZDUSD
Breakout
+12
Multi_TF Candlestick Chart Overlay
Perfect for traders who demand a clear overview of multiple timeframes at a glance.
TDI_Pro
Traders Dynamic Index (TDI) — Divergence Edition
Indicador
NAS100
NZDUSD
XAUUSD
+15
VWAP_MTF
📊 VWAP with MTF & Dynamic Deviation Bands
Indicador
NAS100
Indices
NZDUSD
+7
ICT Killzones & Macros
KILLZONES AND MACRO SESSIONS
Indicador
NAS100
Indices
Prop
+6
ICT_SMC_ToolKit
institutional-level market analysis
Puede interesarle
Indicador
RSI
Breakout
Lozano Price Action
LPA simplifies trading by coloring candles with volume data and RSI levels for trend and reversal insights.
Indicador
Indices
RSI
Signal
+1
[Stellar Strategies] QQE
The QQE indicator is a technical analysis tool designed to identify potential trend changes and trading signals 📈📉
[Stellar Strategies] Inside Bar with Signals
Visually master the Inside Bar strategy with clear breakout signals and professional chart highlighting 📈🔔📉
Indicador
NAS100
Indices
XAUUSD
+2
AlgoCorner DonchianPSAR
Visualize market asymmetry like never before — steady climbs meet sudden drops with the Donchian PSAR
Indicador
Breakout
VIX - volatility indicator
Ride the Volatility – Smart VIX Tool
Indicador
NAS100
Indices
NZDUSD
+9
Volumatic Fair Value Gaps
📊 Detects Fair Value Gaps with lower timeframe volume analysis & clean dashboard 🟢🔴
Indicador
Indices
Commodities
Stocks
+2
XY Bar Info Panel v1.5
Overlay panel showing bar date/time, OHLC, tick Volume, percent change, and market session - fully customizable.
Indicador
RSI
Breakout
Supertrend
+1
Dynamic Trend Gradient
Identifies trends with moving averages & volatility. Base levels = bullish 🐂 or bearish 🐻 signals. Reversals detected!
Mejor valorado
Gratis
Indicador
ATR
Supertrend
PMAX
It's a combination of two trailing stop loss and the other one is well-known ATR-based SuperTrend.
Renko Line Chart
Smart Signal Reversal Trend + Patterns
Indicador
NAS100
NZDUSD
XAUUSD
+10
Relative Moving Average
Bring the RMA to cTrader! This is the Relative Moving Average from TradingView.
Mejor valorado
Gratis
Indicador
Indices
RSI
Signal
Rsi + Volume
This indicator combines RSI (Relative Strength Index) with volume analysis to generate more reliable trading signals.
E7 Polynomial Regression Channel
Polynomial Regression Channel which also reflects the volatility of the underlying asset.
Indicador
Indices
Stocks
Forex
+1
TwoSMA.cs
An indicator that accurately shows the trend direction. A vital tool for clear trading decisions.
SessionPowerZonesPro
Highlights market sessions & overlaps with real-time range & volume stats – perfect for pro scalpers.
Renko 4k Pips
Custom your Renko Brick how do you wish!
Indicador
Bollinger
E7 Indicators Free Overlays
Bollinger Band Cloud, Heiken Ashi, Trend Follower and Parabolic SAR.
Indicador
Grid
NAS100
NZDUSD
+17
Institutional Pattern bY MohammadKHR
Institutional Level Trend Direction at it's best for 2025 & Beyond.