
Market_Session_Forex
Indicador
4 compras
Versión 1.0, Jul 2025
Windows, Mac
4.5
Valoraciones: 2
Descripción
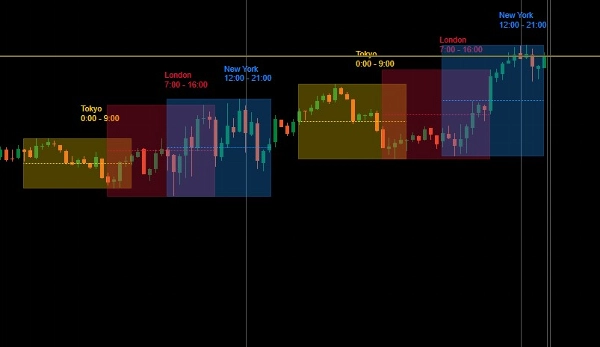
El mercado Forex opera las 24 horas del día a través de sesiones de trading globales superpuestas. Cada sesión refleja la actividad de los principales centros financieros y se caracteriza por diferentes niveles de liquidez, volatilidad y volumen de operaciones.
📊 El gráfico muestra tres sesiones principales en bloques de tiempo coordinados:
🟡 Sesión de Tokio (Sesión Asiática)
🔴 Sesión de Londres (Sesión Europea)
🔵 Sesión de Nueva York (Sesión de EE. UU.)
🧩 Períodos de Superposición:
- Superposición Londres–Nueva York
Periodo más activo del día de trading con volumen máximo y movimientos importantes de precios.
Mis Otros Productos
- Institutional FVG Zones MTF with Confluence
- All-in-One Session Levels Suite
- MARKET_STRUCTURE BOS_CHoCH
- Multi_TF Candlestick Chart Overlay
- ICT Killzones & Macros
- ICT_SMC_ToolKit
- VWAP_MTF
- Traders Dynamic Index (TDI)
- Market_Session_Forex
Resumen
Resumen de IA
Market_Session_Forex is an indicator designed for forex trading that visually delineates the three primary global trading sessions on a chart: the Tokyo (Asian) session, the London (European) session, and the New York (U.S.) session. Each session is displayed in coordinated time blocks, highlighting periods of varying liquidity, volatility, and trading volume. The indicator also marks the London–New York overlap, recognized as the most active trading period with peak volume and significant price movements. This tool aids traders in identifying key market activity windows aligned with major financial centers, facilitating more informed trading decisions based on session timing.
Perfil del indicador
Valoraciones de clientes
4.5
Valoraciones: 2
5 | 50 % | |
4 | 50 % | |
3 | 0 % | |
2 | 0 % | |
1 | 0 % |
Valoraciones de clientes
August 7, 2025
July 31, 2025
ngl, weak ideas are easier to skip and that is enough to keep testing it. It is one check, not the full trade.
Conversación
Preguntas frecuentes
Los productos disponibles a través de cTrader Store, incluidos bots, indicadores y plugins para operar, son proporcionados por desarrolladores de terceros y están disponibles únicamente con fines informativos y de acceso técnico. cTrader Store no es un bróker, por lo que no proporciona asesoramiento de inversión, recomendaciones personales ni ninguna garantía de rentabilidad futura.


![Logotipo de "[Stellar Strategies] Market Session Ultimate"](https://cdn.ctrader.com/image/webp/61ffd537-0125-4246-9e72-42eca1791d64_28232)


Precio
Desde 22/06/2025
73
Ventas
66
Instalaciones gratis