
説明
パラボリックRSIアラートは、相対力指数(RSI)の精度と、カスタムパラボリックSARの動的なトレンド追従能力を組み合わせた強力なインジケーターです。この独自の融合により、トレーダーは高確率の反転ポイントを明確な視覚信号とリアルタイムアラートで特定できます。
使用上の注意:
- インジケーターは1時間以上のタイムフレームで最適に機能します
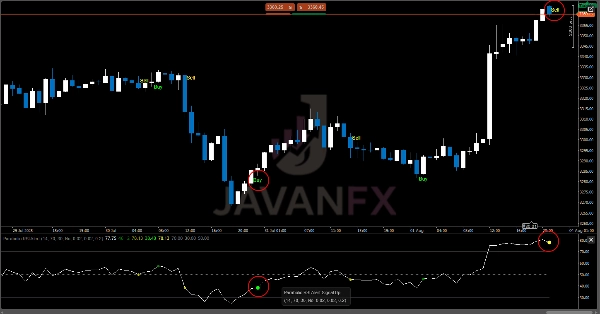
- 買われ過ぎ・売られ過ぎゾーンで反転が起こると強いシグナルが発生します
- 極端なゾーン外で反転が起こると通常のシグナルが表示されます
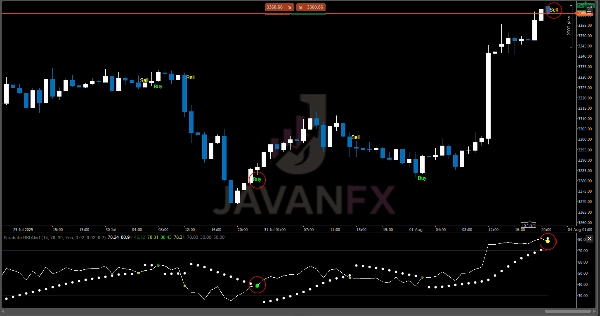
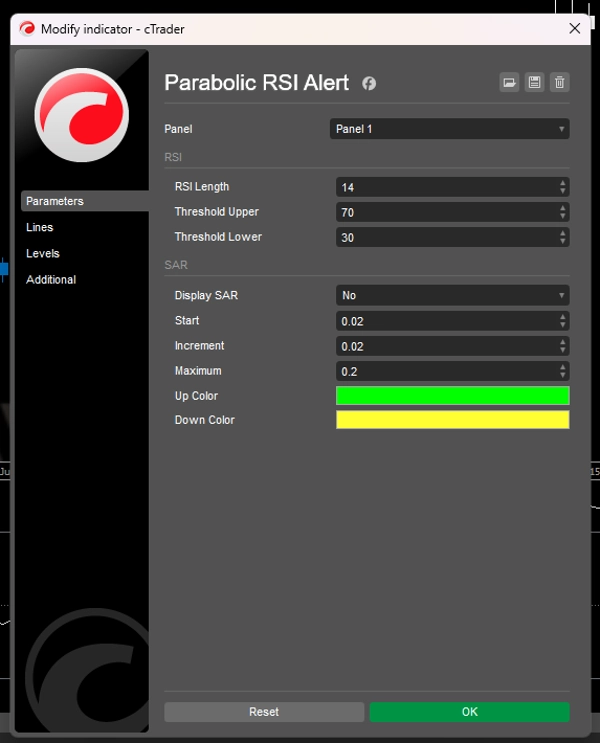
- SARポイントは
Display SARが有効な場合のみプロットされます - エントリーとエグジットポイントの確認には価格アクションや他のインジケーターと組み合わせて使用してください(任意)。
以下のトレーダーに最適:
- 従来のRSI分析の遅延を減らしたい方
- タイムリーなエントリーのために明確な視覚および音声アラートが必要な方
- 主観的なチャート読みよりも機械的なシグナルを好む方
概要
インジケーターのプロフィール
カスタマーレビュー
0.0
レビュー: 0
カスタマーレビュー
この商品にはまだレビューがありません。お使いになったことがある方は、ぜひレビューをお願いします。
ディスカッション
よくあるご質問
cTrader Storeで入手可能な取引ボット、インジケーター、プラグインなどの商品は、第三者の開発者が提供するものであり、情報と技術の取得のみを目的としてご利用いただけます。cTrader Storeはブローカーではなく、投資助言や個人的な推奨を行うことも、将来のパフォーマンスを保証することもありません。


価格
登録日 14/07/2025
60
販売