

説明
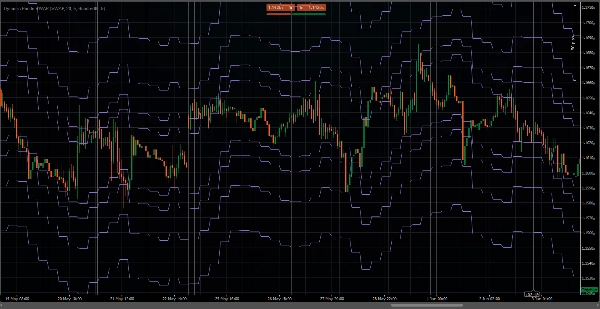
静的なサポートおよびレジスタンスレベルを信用しないでください。このインジケーターは、広く使われているフィボナッチとVWAPを一つのセットアップに組み合わせ、それぞれの欠点を解決します。現在、すべてのレベルはマネーフロー、タイムブロック、および数学的ルールに基づいて動的です。
このインジケーターは、移動VWAP/TWAP平均に基づく階段状の水平線をプロットします。滑らかな連続線の代わりに、平均はX本のバーごと(「階段の一段」)にのみ再計算され、各ステップで垂直にジャンプする平らな水平セグメントを描画します。VWAP/TWAPの上下の線の距離は、ユーザーが選択したパーセンテージスケール(フィボナッチスケール)で乗算されたフィボナッチ数列に従います。
パラメーター
- 平均タイプ – VWAP(出来高加重)またはTWAP(時間加重)。
- 期間(バー数) – 平均計算のための遡及ウィンドウ。
- 上下のライン数 – 各側に描画するフィボナッチ間隔のレベル数(≥2)。
- フィボナッチスケール – 間隔の基本パーセンテージ単位。
- Xバーごとに更新 – 階段の再計算頻度。平均とすべてのラインは更新間は一定のままです。
使い方は?以下のように使用できます:
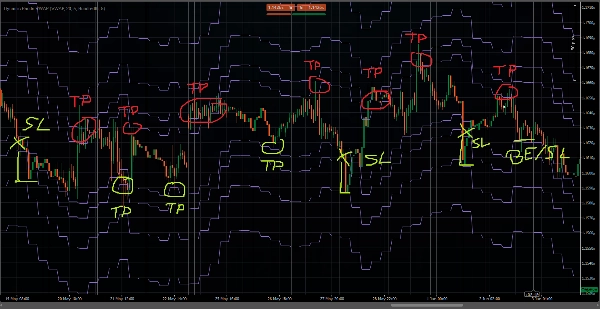
- すべての平均回帰戦略
- サポートおよびレジスタンスの検証
- 最適なエントリーおよびエグジット価格
- 過買い/過売りオシレーター
- マルチタイムフレームの合流点
- ボリンジャーバンドの完全な代替
- その他多数。
概要
AI summary
Dynamic Bands VWAP is a technical indicator that integrates Fibonacci levels with VWAP (Volume Weighted Average Price) or TWAP (Time Weighted Average Price) to provide dynamic support and resistance levels. Unlike static levels, this indicator recalculates averages and plots horizontal lines in a stepped ladder format every set number of bars, creating flat segments that adjust vertically at each update. The spacing of these lines above and below the average follows a Fibonacci sequence scaled by a user-defined percentage.
Key parameters include the choice between VWAP or TWAP averages, the lookback period for calculations, the number of Fibonacci-spaced lines displayed above and below the average, the Fibonacci scale for spacing, and the frequency of updates (every X bars). The indicator bases its dynamic levels on money flow, time blocks, and mathematical rules.
It can be applied in various trading contexts such as mean-reversion strategies, support and resistance validation, identifying optimal entry and exit prices, overbought/oversold oscillation, multi-timeframe confluence, and as a full alternative to Bollinger Bands. The indicator supports volume and bar data inputs and provides visualizations, signals for breakouts, reversals, volatility regimes, and level touches or breaks.
Key parameters include the choice between VWAP or TWAP averages, the lookback period for calculations, the number of Fibonacci-spaced lines displayed above and below the average, the Fibonacci scale for spacing, and the frequency of updates (every X bars). The indicator bases its dynamic levels on money flow, time blocks, and mathematical rules.
It can be applied in various trading contexts such as mean-reversion strategies, support and resistance validation, identifying optimal entry and exit prices, overbought/oversold oscillation, multi-timeframe confluence, and as a full alternative to Bollinger Bands. The indicator supports volume and bar data inputs and provides visualizations, signals for breakouts, reversals, volatility regimes, and level touches or breaks.
インジケーターのプロフィール
インジケーターのカテゴリー
サポート&レジスタンス
出力の種類
ビジュアル表示
シグナル
フィルター
データ要件
バーのみ
取引高
サポート対象のシグナル
ブレイクアウト
反転
ボラティリティ
ラインタッチ
ラインブレイク
カスタマーレビュー
0.0
レビュー: 0
カスタマーレビュー
この商品にはまだレビューがありません。お使いになったことがある方は、ぜひレビューをお願いします。
ディスカッション
よくあるご質問
Fibonacci
Key Levels
Volume
VWAP
Support & Resistance
cTrader Storeで入手可能な取引ボット、インジケーター、プラグインなどの商品は、第三者の開発者が提供するものであり、情報と技術の取得のみを目的としてご利用いただけます。cTrader Storeはブローカーではなく、投資助言や個人的な推奨を行うことも、将来のパフォーマンスを保証することもありません。





















価格
登録日 24/03/2026
13
販売
112
無料インストール