
説明
MACD Pro Trader – 究極のMACDトレーディングインジケーター 🚀
強力でプロフェッショナルグレードのMACDインジケーターをお探しですか? MACD Pro Trader は、トレーディングの意思決定において精度、明確さ、高性能なシグナルを求めるトレーダーのために設計された究極のツールです。初心者でも経験豊富なトレーダーでも、この高度なMACDインジケーターは市場のトレンドを特定し、高確率のトレードセットアップを見つけ、自信を持って利益を最大化するのに役立ちます!
🔥 なぜMACD Pro Traderを選ぶのか?
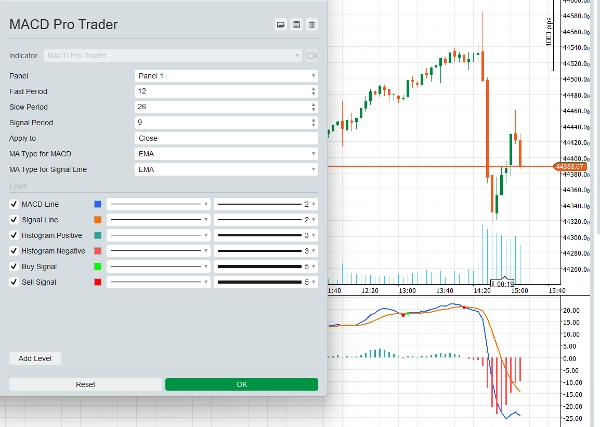
✅ 高度な移動平均のカスタマイズ – MACDラインとシグナルラインの両方にSMA(単純移動平均)またはEMA(指数移動平均)を選択でき、市場の異なる状況に応じてインジケーターを完全にコントロールできます。
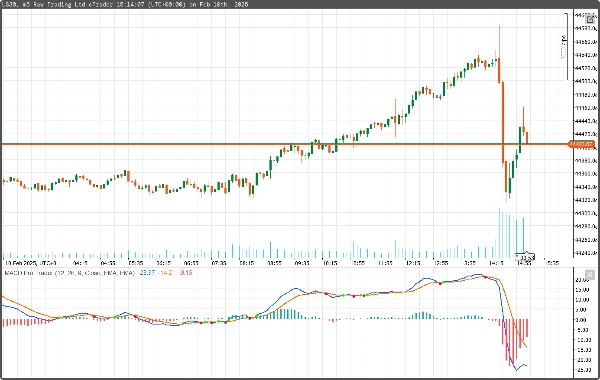
✅ スマートな買い&売りシグナル – MACDラインがシグナルラインをクロスする際に、視覚的に明確な緑と赤のマーカーでエントリーとエグジットのシグナルを提供します。トレードのエントリーで迷うことはもうありません!
✅ トレンドの視覚化に優れたデュアルトーンヒストグラム – 正のヒストグラムバーと負のヒストグラムバーが色分けされており、勢いが自分に有利に変わる瞬間を即座に確認できます。
✅ 柔軟な適用価格オプション – MACDの計算を始値、高値、安値、終値、中央値、典型価格、加重価格に適用して、あなたのトレーディングスタイルに合わせてインジケーターを微調整できます。
✅ デイトレード&スイングトレードに最適 – Forex、株式、指数、暗号通貨での使用を想定しており、1分足のスキャルピングから4時間足のトレードまで対応します。
✅ cTraderとのシームレスな統合 – cTraderに完全最適化されており、リアルタイムのパフォーマンスと最小限の遅延で、従来のMACDインジケーターより優位性を提供します。
📈 MACD Pro Traderを使ったデイトレードの方法
戦略:MACDクロス+モメンタム確認
このシンプルで強力な戦略は、短期的な価格変動を捉え、トレンド市場での利益を最大化するために設計されています。
🔹 ステップ1:トレンドを特定する
- 最初のトリガーとして MACDライン&シグナルラインのクロスオーバー を使用します。
- MACDがシグナルラインを 上抜ける 場合は 強気 のセットアップです。
- MACDがシグナルラインを 下抜ける 場合は 弱気 のセットアップです。
🔹 ステップ2:ヒストグラムで確認する
- 増加する正のヒストグラム は強い強気の勢いを示します。
- 増加する負のヒストグラム は強い弱気の勢いを示します。
- ヒストグラムが弱いかフラットの場合は、より強いシグナルを待ちます。
🔹 ステップ3:トレードに入る
- 買いエントリー: MACDがシグナルラインを上抜け かつ ヒストグラムが緑色に変わったとき。
- 売りエントリー: MACDがシグナルラインを下抜け かつ ヒストグラムが赤色に変わったとき。
🔹 ステップ4:ストップロス&テイクプロフィットを設定する
- ストップロス: 最近のスイングローのすぐ下(買いの場合)または最近のスイングハイのすぐ上(売りの場合)にストップロスを置きます。
- テイクプロフィット: ストップロスの2倍 を目標にし、良好なリスク・リワード比率を確保します(例:10ピップスのリスクで20ピップスの利益を狙う)。
🔹 ボーナスヒント:確認のためにより高い時間足を使う
トレードに入る前に、トレンド方向を確認するために より高い時間足(例:5分足のトレードなら15分足)をチェックしてください。両方の時間足が一致すれば、トレードの成功確率が高まります!
🎯 MACD Pro Traderは誰のため?
✅ 高精度のMACDシグナルを求める外国為替トレーダー。
✅ 迅速で信頼できるエントリーポイントが必要なスキャルパー&デイトレーダー。
✅ トレンドに自信を持って乗りたい株式&暗号通貨トレーダー。
✅ 長期的なモメンタムの変化を特定したいスイングトレーダー。
素晴らしいトレードを逃したり、エントリーのタイミングに苦労しているなら、 MACD Pro Traderはあなたが待ち望んでいた解決策です!
💎 今すぐMACD Pro Traderを手に入れて、トレーディングを次のレベルへ!
🔹 cTraderに100%最適化 – 遅延なし、再描画なし、クリーンで実用的なシグナルのみ。
🔹 即時ダウンロード – 数分で使用開始可能!
🔹 生涯アップデート – 今後のすべての改良を追加費用なしで受け取れます。
📥 今すぐコピーを入手して、より賢くトレードを始めましょう! 🚀
概要
A dual-tone histogram visually represents momentum shifts with color-coded positive and negative bars, enhancing trend analysis. Users can apply MACD calculations to various price types including Open, High, Low, Close, Median, Typical, or Weighted prices to tailor the indicator to their trading style.
MACD Pro Trader is suitable for scalpers, day traders, swing traders, and those seeking to identify both short-term and long-term momentum changes. It is optimized for real-time performance with minimal lag on cTrader. The product includes a recommended trading strategy based on MACD line and Signal line crossovers confirmed by histogram momentum, with guidance on entry, stop loss, and take profit placement. Higher timeframe confirmation is suggested to improve trade probability. The indicator supports multiple timeframes from 1-minute scalping to 4-hour swing trading.
カスタマーレビュー
5 | 50 % | |
4 | 50 % | |
3 | 0 % | |
2 | 0 % | |
1 | 0 % |


