
Descripción
El suavizado Jurik incluye 3 etapas:
1ª etapa - suavizado preliminar mediante EMA adaptativa: MA1 = (1-alpha)*Price + alpha*MA1[1];
2ª etapa - un suavizado preliminar más mediante filtro de Kalman: Det0 = (Price - MA1)*(1-beta) + beta*Det0[1]; MA2 = MA1 + PR*Det0;
3ª etapa - suavizado final mediante filtro adaptativo único Jurik: Det1 = (MA2 - JMA[1]) * (1-alpha)^2 + alpha^2 * Det1[1]; JMA = JMA[1] + Det1;
donde: - Price - Serie de precios - alpha - factor dinámico (se describirá más abajo) - beta - ratio periódico = 0.45*(Length-1)/(0.45*(Length-1)+2) - PR - Ratio de fase: PR = Phase/100 + 1.5 (si Phase < -100 entonces PR=0.5, si Phase > 100 entonces PR=2.5).
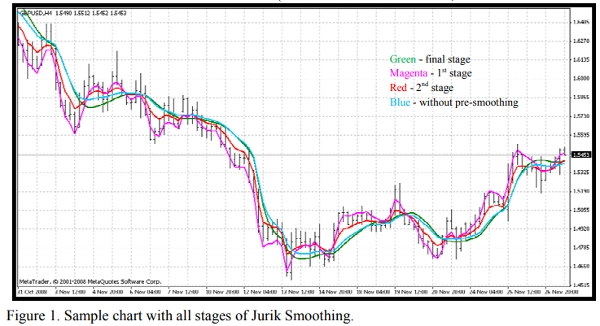
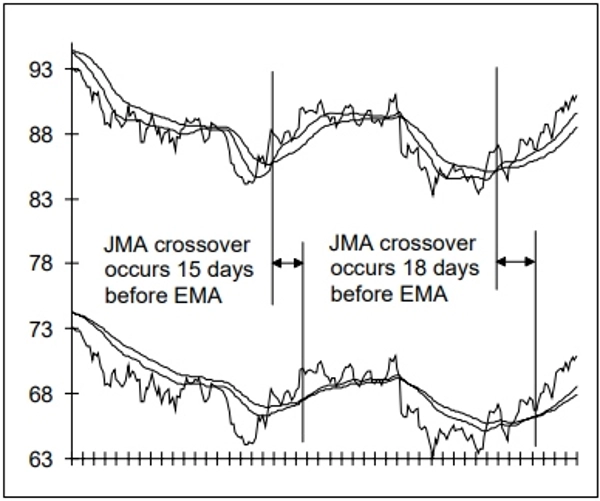
Figura 1. Gráfico de ejemplo con todas las etapas del suavizado Jurik. Puede ver los resultados (Figura 1) de cada etapa mediante el indicador adjunto JurikFilter_v2, cambiando FilterMode: 0 - etapa final (JMA) 1 - 1ª etapa 2 - 2ª etapa 3 - solo suavizado final (sin preliminar).
El Factor Dinámico es el factor periódico (beta) elevado a una potencia (pow):
alpha = beta ^ Pow,
donde: - pow = rVolty ^ pow1 - rVolty - volatilidad relativa del precio - pow1 - potencia de la volatilidad relativa con la siguiente fórmula: pow1 = len1 - 2 (si pow1 < 0.5 entonces pow1 = 0.5),
donde len1 - factor periódico adicional: len1 = Log(SquareRoot(len))/Log(2.0) + 2 (si len1 < 0 entonces len1 = 0).
Así puede ver que el factor dinámico se basa en la volatilidad relativa del precio, proporcionando la adaptabilidad requerida para este tipo de filtro de precio.
La fórmula para la volatilidad relativa del precio es rVolty = Volty/AvgVolty (si rVolty > len1^(1/pow1) entonces rVolty = len1^(1/pow1), si rVolty < 1 entonces rVolty = 1),
donde:
- Volty - volatilidad del precio basada en el cálculo de las llamadas Bandas Jurik (VisualMode = 1).
- AvgVolty - volatilidad promedio para la cual Jurik utiliza un algoritmo bastante complejo de cálculo: AvgVolty = Average(vSum,AvgLen),
donde:
- vSum - suma incremental de (Volty - Volty[10])/10;
- AvgLen - período del promedio (Jurik usa 65).
En mi versión del filtro Jurik uso un promedio simple en lugar del promedio complejo de Jurik
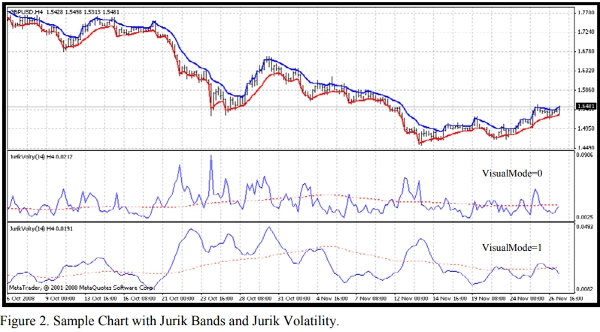
Además, con el indicador adjunto JurikVolty_v1 (Figura 2) puede ver los valores de Volty (VisualMode=0), vSum (VisualMode=1) y AvgVolty (línea roja punteada).
La fórmula para la volatilidad del precio es Volty = máximo entre Abs(del1) y Abs(del2), si Abs(del1) = Abs(del2) entonces Volty = 0,
donde: - del1 - distancia entre el precio y la banda superior del1 = Price - UpperBand - del2 - distancia entre el precio y la banda inferior del2 = Price - LowerBand Las Bandas Jurik son diferentes de cualquier banda de precio conocida como Bollinger, Keltner, Donchian, Fractal, etc.: si del1 > 0 entonces UpperBand = Price sino UpperBand = Price - Kv*del1 si del2 < 0 entonces LowerBand = Price sino LowerBand = Price - Kv*del2,
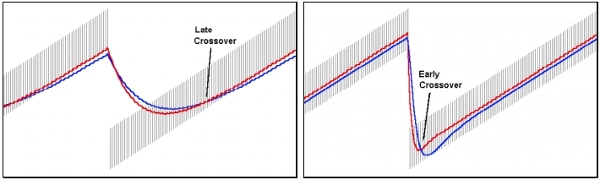
donde: - Kv - factor de volatilidad Kv = bet ^ SquareRoot(pow2). Es fácil ver que estas bandas pueden ser la base para un indicador de seguimiento de tendencia como el Parabólico de Wilder. Por lo tanto, puede ver que prácticamente no hay lugares oscuros en el algoritmo de la Media Móvil Jurik (JMA)
Resumen
Valoraciones de clientes
5 | 0 % | |
4 | 100 % | |
3 | 0 % | |
2 | 0 % | |
1 | 0 % |


