present
Daftar dan dapatkan diskon $50 untuk pembelian pertama Anda
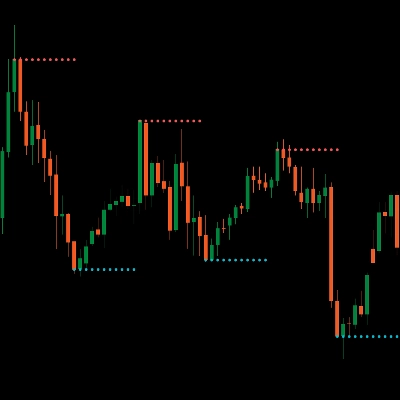
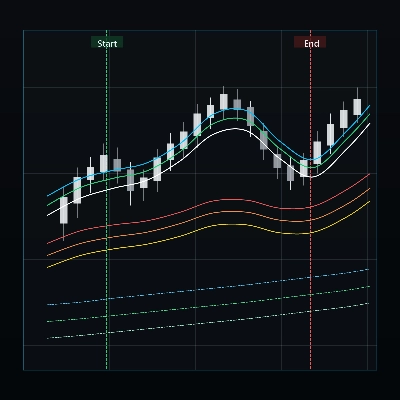
Trading product for IR VLine Indikator, image 1
IR VLine
5.0
Ulasan: 1
5.64K
Instal gratis

Deskripsi

jangan pindah ke akhir grafik setelah mengubah kerangka waktu.

sebaiknya digunakan untuk riwayat dekat. untuk riwayat panjang ini memiliki keterlambatan.

Ringkasan

Ringkasan AI
IR VLine is a chart indicator designed to maintain the current chart position without automatically moving to the end after changing the timeframe. It is optimized for analyzing recent market history, providing timely visual references for near-term data. When applied to longer historical periods, users may experience some delay in updates. This tool supports traders who require stable chart positioning during timeframe adjustments for short-term analysis.
Profil indikator

Diskusi

Ulasan pelanggan

5.0
Ulasan: 1
5
100 %
4
0 %
3
0 %
2
0 %
1
0 %
Ulasan pelanggan
September 30, 2025
Very useful and handy tool

Pertanyaan umum

Produk-produk yang tersedia melalui cTrader Store, termasuk bot trading, indikator, dan plugin, disediakan oleh pengembang pihak ketiga serta hanya ditujukan untuk akses teknis dan informasi. cTrader Store bukan broker dan tidak menyediakan saran investasi, rekomendasi pribadi, atau jaminan apa pun tentang kinerja di masa mendatang.

Produk lain dari penulis ini

Logo "IR Candle MTF"
4.6
(6)
Gratis
with this indicator you could see other time frame candle in your chart.
show spread on chart
some user add moving average to macd to see better. in ctrader 4.3.11 there is a problem with this . I make a macd tha
this indicator show macd on chart.
Multi Time Frame Moving Average is a powerful and flexible indicator for cTrader
 this moving include everything that a trader needs from Moving Average.
this indicaotr show distance between Tenkan to Kijun, Close to Kijun and Close to Tenkan 
Add Slowing to IR Moving Average.
IR Candle Open plots customizable opening price lines for daily, weekly, and monthly candles
Coral indicator
you could put your check list in your chart you could split your test with “,” you could put your checklist in indicat
this indicator show other time frame close in lower time frame. for ex: show daily close in m 15.

Anda mungkin juga suka

Auto-detect swing highs/lows. Spot reversals, map structure, and filter noise with adjustable strength.
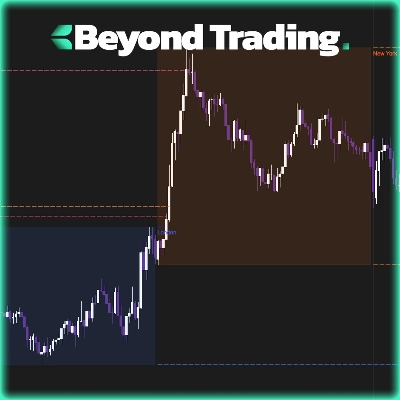
Tracks NY, London, Tokyo, Sydney sessions with custom visuals, and a real-time expanding range box and breakout High/Low
Pivot Point MultiTimeFrame with Order Block
🚀 Automated Elliott Wave & Fibonacci tool for cTrader. Spot trends, corrections & retracements fast.
Statistically-grounded trend channels via linear regression — clear trend & reversal zones.
Right-anchored cTrader Volume Profile with VAH/VAL/POC, LVZ, top volume+EMA, themes, and fast, readable visuals.
Daily/Weekly/Monthly - Highs & Lows Indicator (Customizable Settings)
Market structure signals graded A to C, each with a drawn trade plan, plus an adaptive trend ribbon and a trend matrix
Multi-timeframe moving averages with session lines for structured trend analysis directly on the chart.
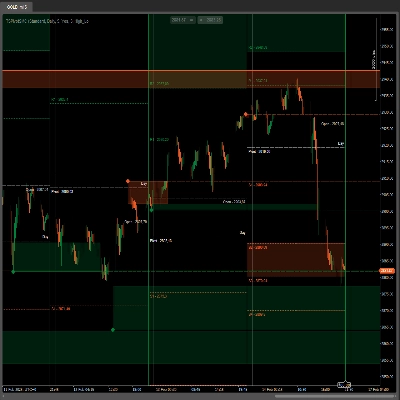
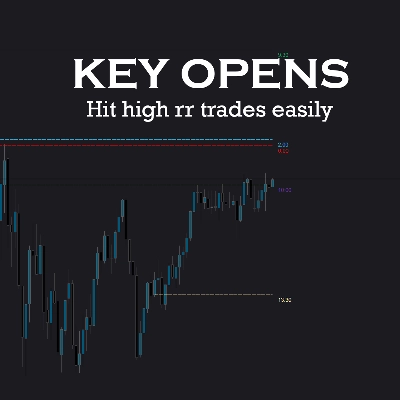
Key NY session opens for NASDAQ (US100) & SP500 to find Tick Precise Entrys for High R:R intraday setups.
Momentum oscillator identifying reversals using dual WaveTrend lines, histogram, and OB/OS levels with optional signals.
GOLD SENTINEL v1.0 - A CANDLE-COLORING INDICATOR FOR GOLD.
MACD Advanced -- It combines the standard MACD logic with a rich set of visual tools
Explore Elliott wave counts, three swing sizes and example levels with an interactive cTrader chart panel.
Bayesian theory** to forecast a future price while providing **uncertainty ranges** that represent upper and lower bound
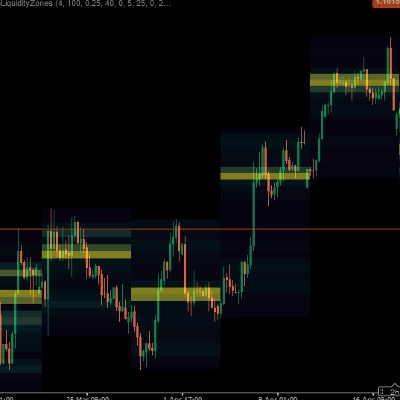
Heatmap Liquidity Zones Visualize volume-at-price, uncover hidden support/resistance, and track market liquidity in real
Smart Money Concepts (SMC) indicator with real-time Fair Value Gap (FVG) boxes, $50 round numbers, and live market HUD.
The Professional “All-in-One” Trading Suite (buy and sell indicator)

Harga

5.64K
Instal gratis