
IR Macd on Chart
مؤشر
416 التنزيلات
الإصدار 1.0، Jan 2025
Windows, Mac
5.0
التقييمات: 1
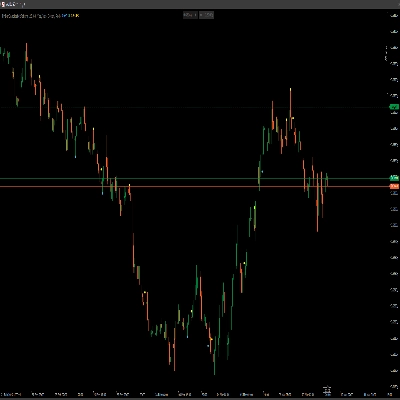
الوصف
هذا المؤشر يعرض MACD على الرسم البياني.
الملخص
ملخص الذكاء الاصطناعي
IR Macd on Chart is a trading indicator that displays the Moving Average Convergence Divergence (MACD) directly on the price chart. It provides a visual representation of the MACD, a momentum indicator used to identify trend direction and potential reversals by showing the relationship between two moving averages of a security’s price. This indicator integrates the MACD histogram and signal line within the chart interface, enabling traders to analyze momentum without switching views. It supports standard MACD functionality and is categorized under momentum indicators.
ملف تعريف المؤشر
تقييمات العملاء
5.0
التقييمات: 1
5 | 100 % | |
4 | 0 % | |
3 | 0 % | |
2 | 0 % | |
1 | 0 % |
مناقشة
الأسئلة الشائعة
MACD
يتم توفير المنتجات المتاحة من خلال cTrader Store، بما في ذلك روبوتات التداول والمؤشرات والإضافات، من قبل مطوري الطرف الثالث وإتاحتها لأغراض الوصول المعلوماتي والفني فقط. cTrader Store ليس وسيطًا ولا يقدم نصائح استثمارية أو توصيات شخصية أو أي ضمان للأداء المستقبلي.


![شعار "[Hamster-Coder] Bollinger Bands"](https://cdn.ctrader.com/image/webp/21d8e5d6-fb11-4bac-b9ee-cd05c2b76804_30327)


السعر
5.12K
التثبيتات المجانية