present
Sign up and get $50 off your first purchase
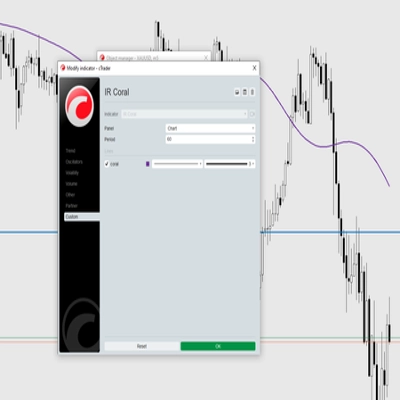
Trading product for IR Coral Indicator, image 1
IR Coral
5.0
Reviews: 1
5.66K
Free installs

Description

Coral indicator


Summary

AI summary
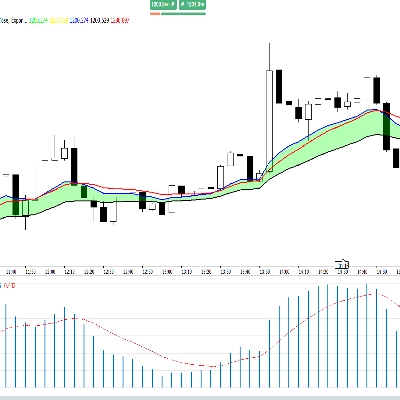
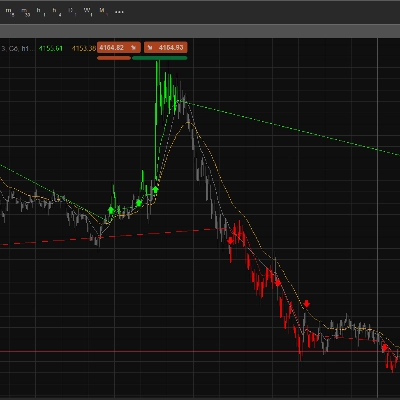
IR Coral is a technical indicator designed for use in trading platforms. It provides analytical insights based on market data to assist traders in making informed decisions. The product functions as a standalone indicator without specified trading strategies, timeframes, or market symbols. It does not include built-in risk management parameters or position sizing guidelines. IR Coral is intended for integration within trading interfaces to enhance market analysis through its indicator outputs.
Indicator profile

Discussion

Customer reviews

5.0
Reviews: 1
5
100 %
4
0 %
3
0 %
2
0 %
1
0 %
Customer reviews
August 2, 2025

FAQ

Products available through cTrader Store, including trading bots, indicators and plugins, are provided by third-party developers and made available for informational and technical access purposes only. cTrader Store is not a broker and does not provide investment advice, personal recommendations or any guarantee of future performance.
More from this author

with this indicator you could see other time frame candle in your chart.
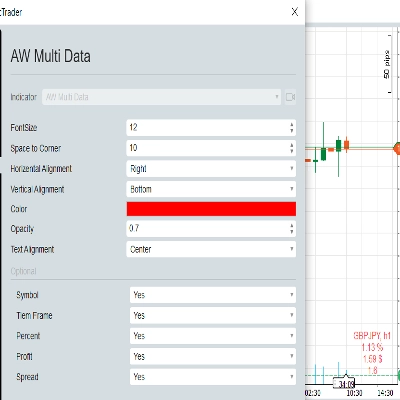
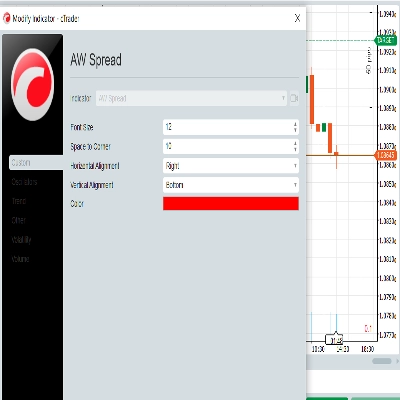
show spread on chart
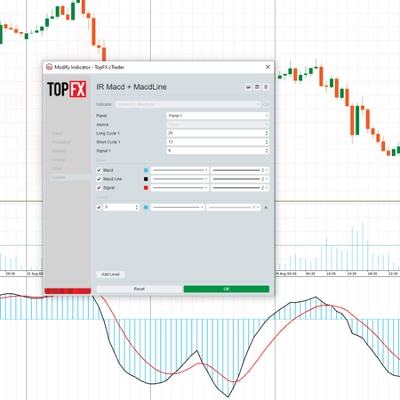
some user add moving average to macd to see better. in ctrader 4.3.11 there is a problem with this . I make a macd tha
this indicator show macd on chart.
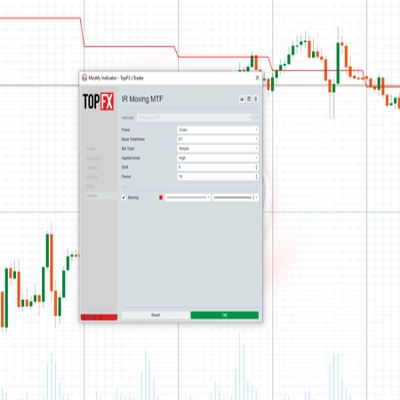
Multi Time Frame Moving Average is a powerful and flexible indicator for cTrader
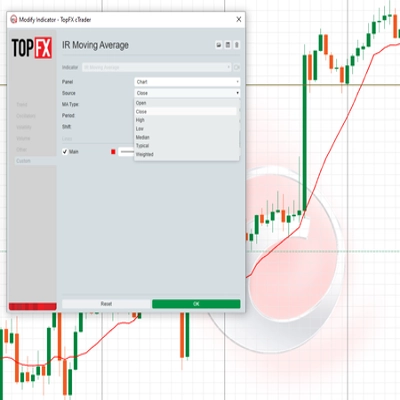
 this moving include everything that a trader needs from Moving Average.
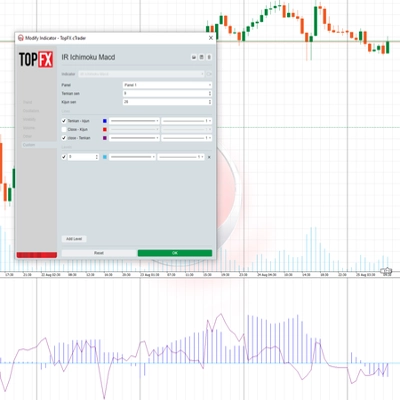
this indicaotr show distance between Tenkan to Kijun, Close to Kijun and Close to Tenkan 
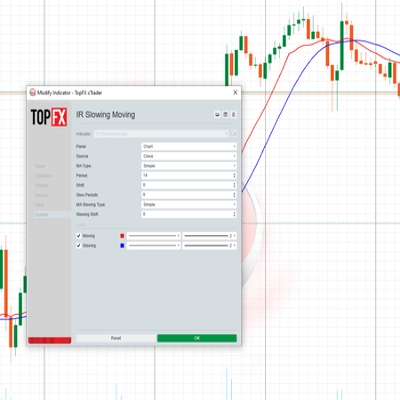
Add Slowing to IR Moving Average.
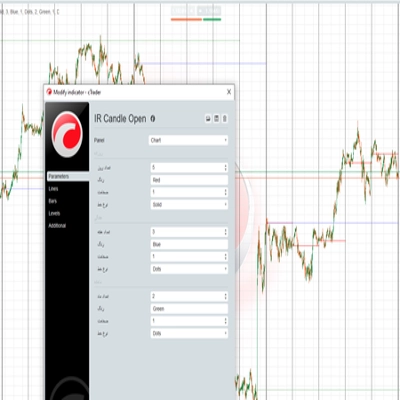
IR Candle Open plots customizable opening price lines for daily, weekly, and monthly candles
you could put your check list in your chart you could split your test with “,” you could put your checklist in indicat
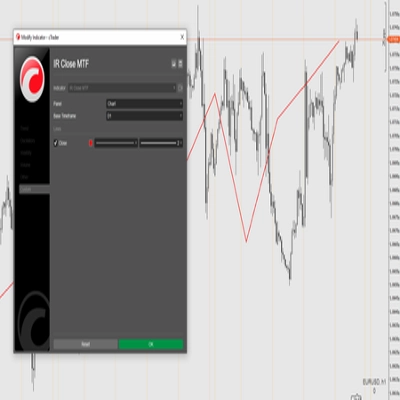
this indicator show other time frame close in lower time frame. for ex: show daily close in m 15.
don't move to the end of chart after timeframe changing. it should be better to use for near history. for long history

You may also like

GOLD SENTINEL v1.0 - A CANDLE-COLORING INDICATOR FOR GOLD.
Detects Gartley, Bat, Butterfly, Crab, Shark & Cypher patterns and backtests each one's real win rate.
PRO Liquidity Sweep + FVG Combo detector with custom Gold/Blue signals & alerts
Track the Movement of Market Assets with an Oscillator Scanner in Real-Time!
an all-in-one Smart Money Concepts (SMC) toolkit featuring Premium/Discount zones.
CandleColourFlow MultiFx - optimized to work on Fx Majors, Fx MInors, Fx Crosses
Orderblocks with Multi-Timeframe.
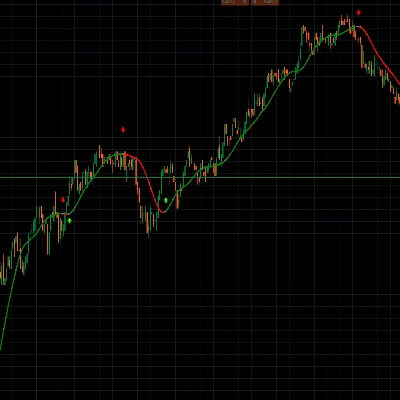
Coloring trendline/ Colored Trendline / Color Trendline
[ANALYTICAL/INFORMATIONAL] Track NET positions, Break-Even & Drawdown. No order execution.
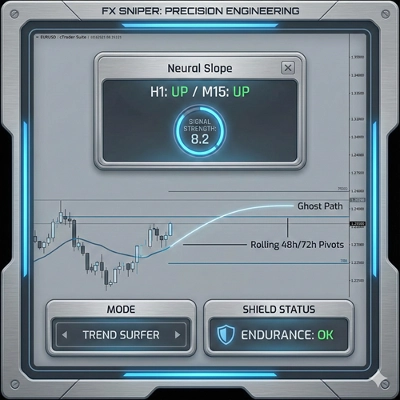
FX Sniper: Multi-pair Forex analysis tool. Features trend logic, adaptive pivots, and momentum filtering for major pairs
MCDX is a powerful and innovative indicator.
Identifies TRENDING, RANGING and VOLATILE markets with pullback detection. Anti-noise filter. Works on ANY chart.
This indicator can be used to: change color, shape size, position, change font, increase or decrease, and other function
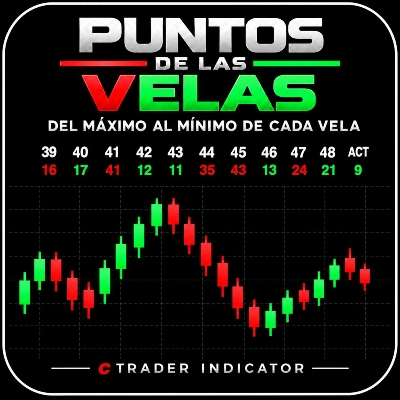
Mide en puntos la distancia entre el Máximo y el Mínimo alcanzados por cada vela, incluida la vela actual.
A simple indicator that tracks the value of your open trades in pips.
The ZigZag indicator is a technical analysis tool primarily used to identify key price reversal points.
Anchor volume profiles to pivots with POC, VAH, VAL and real-time insights for clearer trade decisions.
Visual Trend Momentum is a MA/ATR/Volume trend tool. Visual signals for strong trends & reversals. Customizable. 📈📉

Price

5.66K
Free installs