present
Zarejestruj się i otrzymaj 50 $ zniżki na pierwszy zakup
Trading product for IR Spread Wskaźnik, image 1
IR Spread
5.0
Opinie: 2
5.63K
Bezpłatne instalacje

Opis

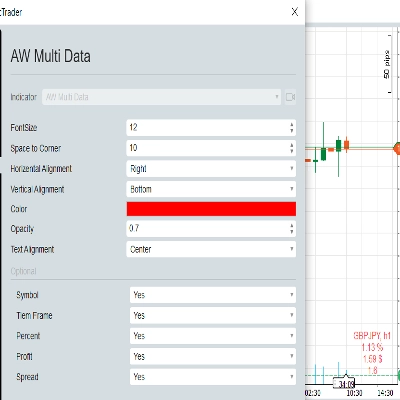
pokaż spread przy aktualizacji wykresu

Telegram Channle wspiera nas, aby uzyskać więcej darmowych wskaźników i botów

Podsumowanie

Podsumowanie AI
IR Spread is a trading indicator designed to display the spread directly on the chart during updates. It provides real-time visualization of the spread, helping traders monitor this key metric within their trading platform interface. The indicator integrates seamlessly with chart updates, ensuring that spread information is current and easily accessible.
Profil wskaźnika

Dyskusja

Opinie klientów

5.0
Opinie: 2
5
100 %
4
0 %
3
0 %
2
0 %
1
0 %
Opinie klientów
June 4, 2026
didn't check deep enough so far but it seems perfect and smooth
November 18, 2025

Częste pytania

Produkty dostępne za pośrednictwem cTrader Store, w tym boty handlowe, wskaźniki i wtyczki, dostarczane są przez deweloperów zewnętrznych i udostępniane wyłącznie w celach informacyjnych oraz w celu zapewnienia dostępu technicznego. cTrader Store nie jest brokerem i nie zapewnia doradztwa inwestycyjnego, nie udziela spersonalizowanych rekomendacji ani nie gwarantuje przyszłych wyników.

Więcej od tego autora

Logo „IR Candle MTF”
4.6
(6)
Za darmo
with this indicator you could see other time frame candle in your chart.
some user add moving average to macd to see better. in ctrader 4.3.11 there is a problem with this . I make a macd tha
this indicator show macd on chart.
Multi Time Frame Moving Average is a powerful and flexible indicator for cTrader
 this moving include everything that a trader needs from Moving Average.
this indicaotr show distance between Tenkan to Kijun, Close to Kijun and Close to Tenkan 
Add Slowing to IR Moving Average.
IR Candle Open plots customizable opening price lines for daily, weekly, and monthly candles
Coral indicator
you could put your check list in your chart you could split your test with “,” you could put your checklist in indicat
this indicator show other time frame close in lower time frame. for ex: show daily close in m 15.
don't move to the end of chart after timeframe changing. it should be better to use for near history. for long history

Możesz także polubić

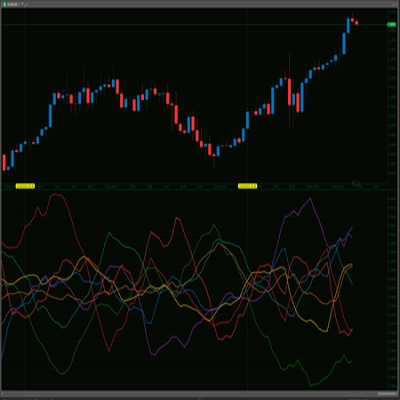
RCS: 8 majors! AUD,USD,EUR,JPY,GBP,CAD,CHF,NZD. Find how strong each currency is relatively and trade smarter!
The only cTrader FVG indicator with Breakaway Gap detection, mitigation tracking, and full multi-asset compatibility.
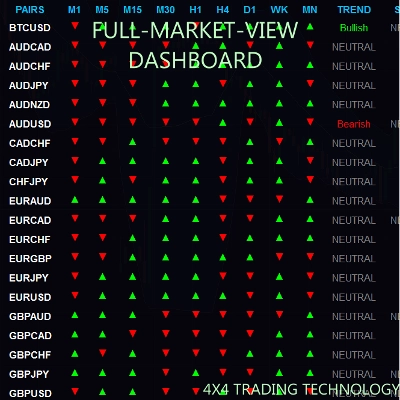
The FULL-MARKET-VIEW-DASHBOARD is a professional-grade trading suite for cTrader that eliminates market noise.
Configure, simulate, and analyze trading strategies with custom filters, multi-target exits, and detailed performance me
Tape Reading indicator ,book and flow analysis
HMA MTF 2.0 (Multi-Timeframe )
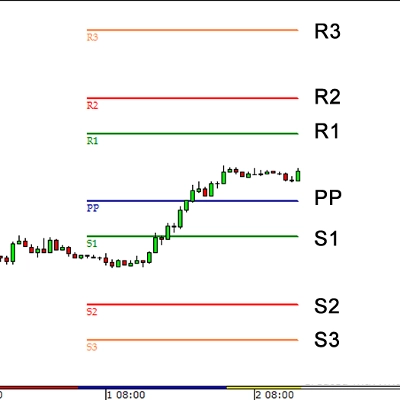
Pivot Points Standard — All-in-One Multi-Timeframe Pivot Indicator for cTrader
Minimalist ADX indicator using dynamic dots for a cleaner and faster trend strength visualization.
Easy Trade: Trend & Breakout Indicator for cTrader
Logo „ZigXRay”
4.6
(5)
$29
/
$49
ZigZag Market Structure Identifier - Multi-Layer Scanner: Convergent Pivot Detection, 4-TF Overlay & Naked Chart Mode.
Fractal Arrow Buy and Sell Indicator
Daily Pivot Points plots key support and resistance levels to guide precise trading decisions.
Compare up to 27 symbols across eight timeframes with seven analysis engines and an interactive cTrader dashboard.
Multi-indicator confluence HUD & real-time backtest engine to detect trend alignment and filter high-probability setups.
Market Structure Indicator – Your Trading Map in a Noisy Market. No more Panicking Which one, Where, Why and How.
🚀 QQEX Trinity Indicator - The Ultimate Trading Filter 🚀
Strong Supertrend Turn Market Movement into a Clear Map Market analysis
Detects valid Fair Value Gaps from strong 3-bar patterns. Keep drawing unfilled gaps until price fills them.

Cena

5.63K
Bezpłatne instalacje