IR Macd on Chart
"IR Macd on Chart" logo
5.0
03/09/2025
272
Desktop
Since 23/01/2025
Free installs
3133

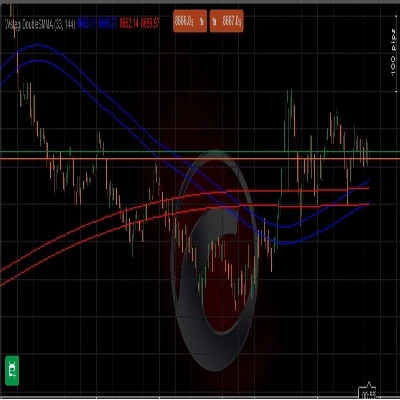
this indicator show macd on chart.

More from this author
IR Candle MTF
with this indicator you could see other time frame candle in your chart.
IR Spread
show spread on chart
IR Macd + MacdLine
some user add moving average to macd to see better. in ctrader 4.3.11 there is a problem with this . I make a macd tha
IR Moving Average
 this moving include everything that a trader needs from Moving Average.
IR Ichimoku Macd
this indicaotr show distance between Tenkan to Kijun, Close to Kijun and Close to Tenkan 
IR Slowing Moving
Add Slowing to IR Moving Average.
IR Moving MTF
multi time frame moving averge. you could choose different type of price like median ,high and ... and differnt type of
IR CheckList
you could put your check list in your chart you could split your test with “,” you could put your checklist in indicat
IR Coral
Coral indicator
IR VLine
don't move to the end of chart after timeframe changing. it should be better to use for near history. for long history
IR Multi Data
show symbol and time fram, daily net profit percent, daily net profit, and spread ln your chart. consider that timezone
IR Close MTF
this indicator show other time frame close in lower time frame. for ex: show daily close in m 15.
IR Candle Open
IR Candle Open plots customizable opening price lines for daily, weekly, and monthly candles
IR Open Connector
This indicator connects the opening prices of higher timeframe candles (Daily, Weekly, Monthly, or
You may also like
Indicator
Breakout
VIX - volatility indicator - Renko
Volatility indicator for Renko.
Indicator
Indices
Prop
Commodities
+3
OBScope
A cutting-edge indicator designed to detect and visualize high-probability zones based on swing highs, swing lows.
IR Candle Open
IR Candle Open plots customizable opening price lines for daily, weekly, and monthly candles
TDI_Pro
Traders Dynamic Index (TDI) — Divergence Edition
pATR
An indicator that redefines ATR by applying a percentile-based filter giving traders a grounded view of volatility.
Indicator
Breakout
VIX - volatility indicator
Ride the Volatility – Smart VIX Tool
Indicator
RSI
EURUSD
MACD
Supply&Demand
Precision Supply & Demand zones indicator—automatically plots key buy/sell areas on your chart for smarter entries.
Indicator
Breakout
Forex
support and resistance
Support and Resistance Line Indicator with Higher Timeframe Filter
Rsi Scalp Indi
RSI Scalper delivers split‑second entries on volatile assets.
Indicator
Forex
EURUSD
USDJPY
4 Currencies V2_NSC
Relative Currency Strength 4 Currencies: AUD USD EUR JPY
Indicator
Indices
Breakout
Forex
+2
Time zone pro
FREE Global Trading Sessions Indicator
Indicator
Signal
[Stellar Strategies] Wave Trend Pro
Momentum oscillator identifying reversals using dual WaveTrend lines, histogram, and OB/OS levels with optional signals.
Indicator
RSI
Indices
ATR
+3
Divergency 1.1_withSourceCode
🔍 Divergency Indicator for cTrader (Update v1.1)
ZigZag Price Liquidity Projection
📊 ZigZag Liquidity Projection: Predict bounces/breaks using pivots, ATR & volume.
Indicator
NAS100
NZDUSD
XAUUSD
+10
RT Qualitative Quantity Estimation
Unlock trading precision with QQE! Dual QQE indicators with a Bollinger Bands zero line provide clear buy/sell signals.
Indicator
RSI
XAUUSD
Breakout
+4
ICT Power of 3
🎯 Auto-plots key zones (Accumulation, Manipulation, Distribution) . Reveals institutional traps & trends.
Indicator
Grid
NAS100
NZDUSD
+17
Institutional Volume Supply Demand
Volume Profile Supply Demand
Binary Options Signals Pro
Binary Options Signals Pro – Precision Trading at Your Fingertips