
SMC
Indicator
201 downloads
Version 1.0, Feb 2026
Windows, Mac
Description
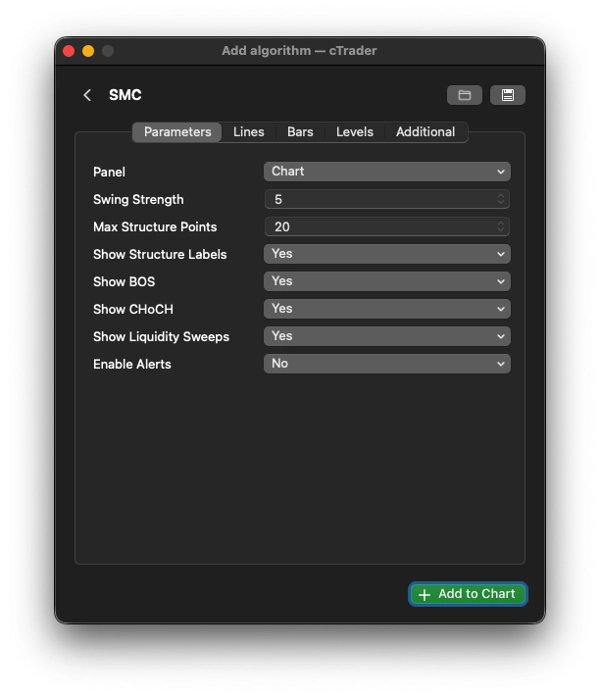
Core logic summary – how it decides what is what
- Detects swings using classic fractal logic (SwingStrength bars left + right)
- Default = 5 → reasonably clean swings on most timeframes
- Determines trend from the last two highs + last two lows:
- HH + HL → Bullish trend
- LH + LL → Bearish trend
- BOS / CHoCH detection (on close):
- Close > previous swing high
- If trend was bullish → BOS (continuation)
- If trend was bearish → CHoCH (potential reversal)
- Close < previous swing low → opposite logic
- Liquidity sweep (very common SMC pattern):
- High wick above last swing high but close below it → bullish sweep (likely fakeout up)
- Low wick below last swing low but close above it → bearish sweep
Typical SMC trading usage of such an indicator
- Look for CHoCH + liquidity sweep in the opposite direction → early reversal setups
- Trade in direction of BOS after a pullback / sweep
- Avoid trading against the structure shown by HH/HL vs LH/LL labels
- Many traders wait for sweep → CHoCH/BOS confirmation sequences
Summary
AI summary
The Dominator SMC Base is a Smart Money Concept (SMC) indicator designed to analyze market structure and identify key trading signals. It detects market swings using classic fractal logic by evaluating swing strength bars on both sides, with a default setting optimized for clean swings across various timeframes. The indicator determines trend direction by comparing the last two highs and lows, classifying trends as bullish (higher highs and higher lows) or bearish (lower highs and lower lows).
It identifies Break of Structure (BOS) and Change of Character (CHoCH) events based on candle closes relative to previous swing highs and lows, signaling potential trend continuations or reversals. The indicator also detects liquidity sweeps, characterized by wicks extending beyond prior swing points but closing within the range, indicating possible fakeouts.
Typical usage involves looking for CHoCH combined with liquidity sweeps for early reversal setups, trading in the direction of BOS after pullbacks or sweeps, and avoiding trades against the established market structure. The indicator supports analysis across multiple markets including Forex, cryptocurrencies, stocks, indices, and commodities, and is applicable on various timeframes. It integrates concepts such as fair value gaps and momentum indicators like RSI to enhance market structure analysis.
Indicator profile
Customer reviews
0.0
Reviews: 0
Customer reviews
No reviews for this product yet. Already tried it? Be the first to tell others!
Discussion
FAQ
BTCUSD
Forex
Breakout
Indices
EURUSD
Commodities
GBPUSD
NZDUSD
RSI
Prop
ZigZag
Scalping
Fair Value Gap
SMC
Crypto
Stocks
XAUUSD
NAS100
USDJPY
Products available through cTrader Store, including trading bots, indicators and plugins, are provided by third-party developers and made available for informational and technical access purposes only. cTrader Store is not a broker and does not provide investment advice, personal recommendations or any guarantee of future performance.
More from this author


Price
Since 01/12/2025
201
Free installs