
Description
Dominator M4tr1x
This is a basic informative tool that combines smart-money price structure analysis on the chart with multiple information dashboard panels. Here's a breakdown of every major system:
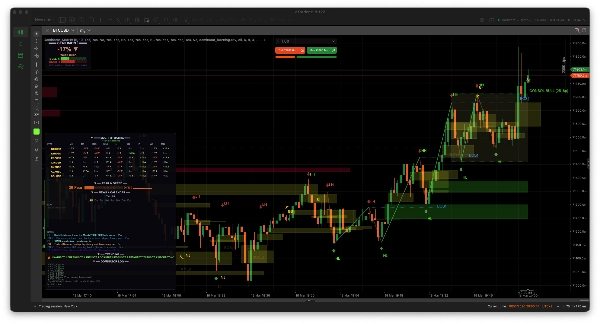
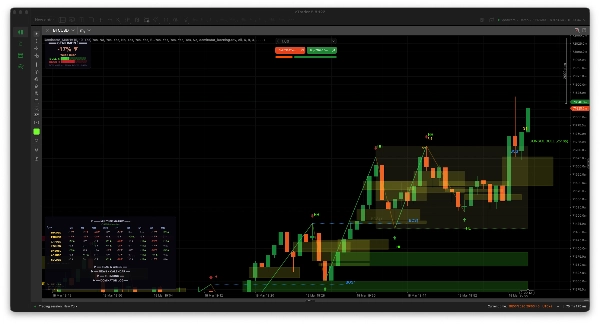
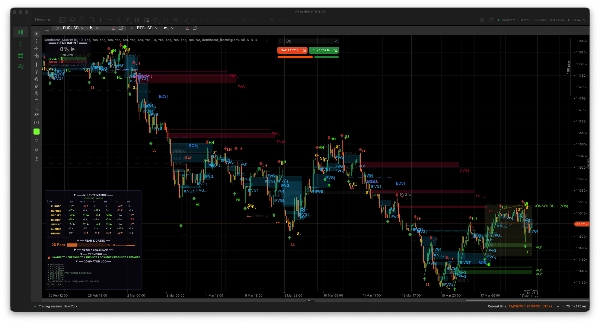
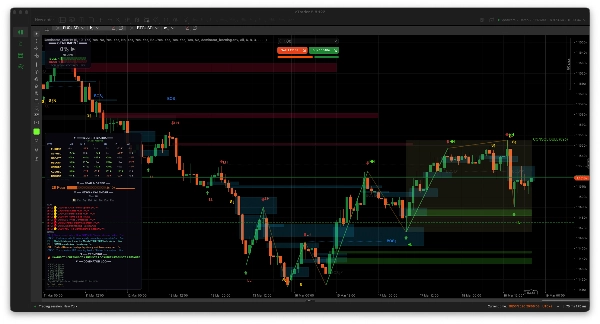
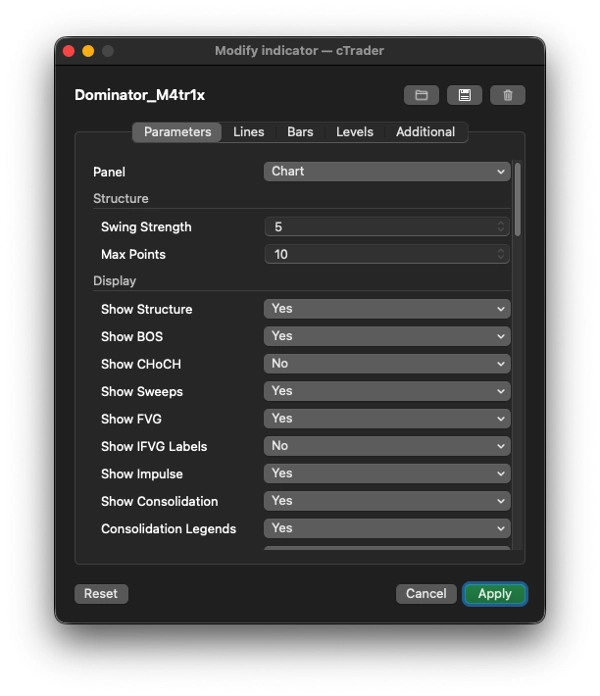
1. 📊 ON-CHART: Smart Money Structure Analysis
Draws directly on the price chart:
Feature
What it does ;
Swing Detection
Identifies swing highs/lows using a configurable lookback strength, marks them with arrows (▲/▼)
Structure Labels
Labels each swing as HH (Higher High), HL (Higher Low), LH (Lower High), LL (Lower Low) to map market structure
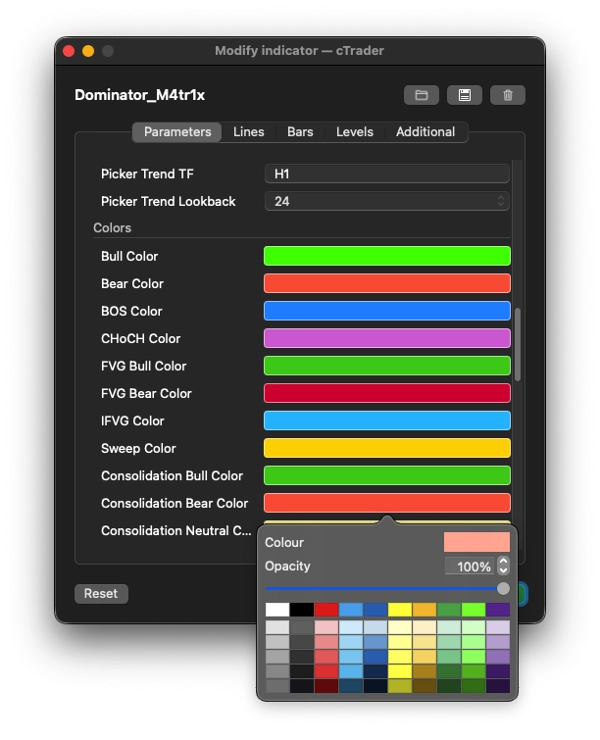
BOS (Break of Structure)
Draws dotted lines + labels when price breaks a prior swing high/low in the direction of the trend
CHoCH (Change of Character)
Same as BOS but against the trend — signals a potential trend reversal
Break Invalidation
If price reverses back through a BOS/CHoCH level, it marks it as failed (greyed out with ✗) and logs it
Liquidity Sweeps
Detects when price wicks above a swing high (or below a swing low) but closes back inside — a classic liquidity grab pattern
FVG (Fair Value Gaps)
Detects 3-candle imbalances (gaps between candle 1's high and candle 3's low). Draws colored rectangles on chart
IFVG (Inversed FVG)
When price returns to fill an FVG, it labels it as "IFVG" (the gap becomes a potential support/resistance zone)
FVG Invalidation
If price closes decisively through an FVG zone, it's marked as invalidated
Impulse Waves
Connects swing points with trend lines — green for impulse legs (with-trend), yellow for corrective legs
Consolidation Zones
Detects when consecutive swing highs and lows are within a narrow ATR-based range, draws a box with a "CONSOL BULL/BEAR/NEUTRAL" label showing direction bias and pip width
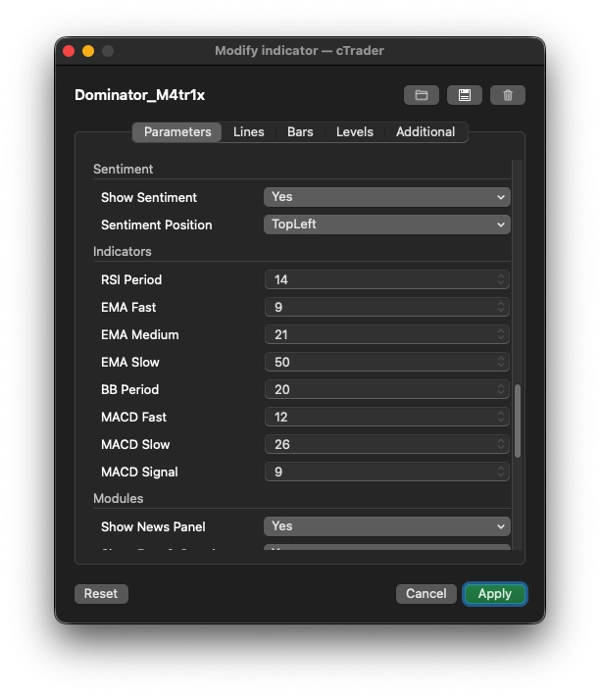
2. 📈 SENTIMENT PANEL (top-left by default)
A real-time bull/bear scoring gauge for the current chart symbol/timeframe using:
- RSI (oversold/overbought + divergence detection)
- MACD (crossovers, histogram momentum)
- 3 EMAs (fast/medium/slow alignment and price position relative to them)
- Bollinger Bands (price at upper/lower band extremes)
Displays:
- A percentage score from -100% to +100% (e.g., "+67% STRONG BULL")
- Visual bull vs. bear point bars (█████░░░░)
- Running signal statistics (total signals, confirmed, invalidated, accuracy %)
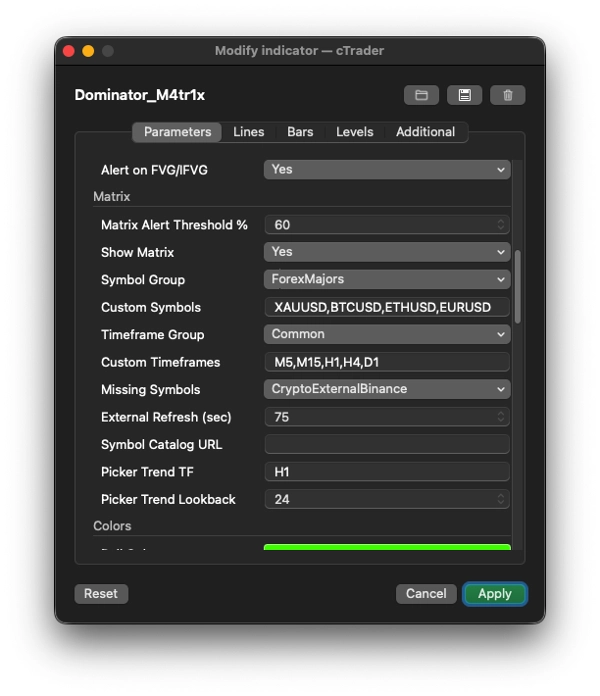
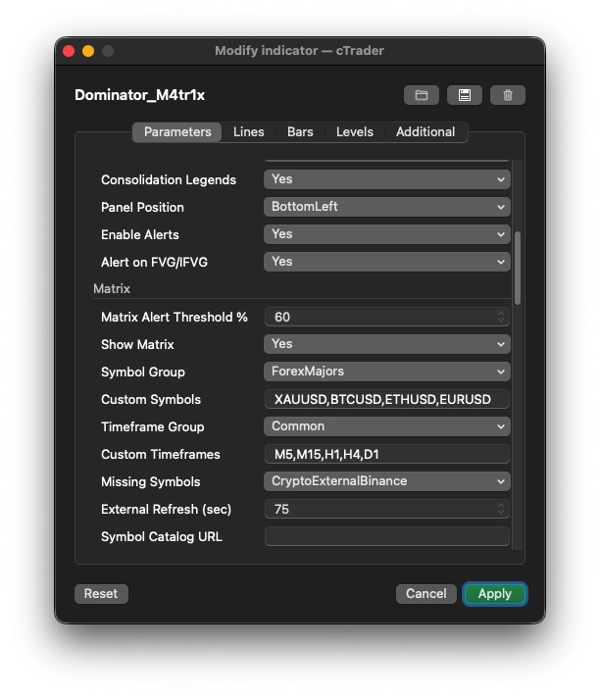
3. 🔢 MULTI-TIMEFRAME MATRIX (main panel)
A grid/heatmap showing bull/bear sentiment scores across multiple symbols × multiple timeframes simultaneously.
Aspect
Details
Symbol groups
Forex Majors/Minors/Exotics, Crypto, Indices, US Stocks, Metals, Energy, Commodities, or Custom
Timeframe groups
Common (M5–W1), All, or Custom
Each cell
Shows a color-coded score like "+42▲" (green) or "-67▼" (red) using the same RSI/MACD/EMA/BB scoring engine
Symbol resolution
Extremely robust — auto-detects broker naming conventions (suffixes like .r, m, .cash, slashes like EUR/USD), tries dozens of alias permutations, caches results
External data
For symbols the broker doesn't carry (especially crypto), fetches OHLC data from Binance, Bybit, OKX, Kraken, Bitfinex APIs (free, no key needed)
Premium APIs
Optionally supports TwelveData, AlphaVantage, Polygon, Stooq for stocks/indices/forex via API keys
Interactive
Click any symbol name → opens a searchable symbol picker with 100+ symbols across all categories, showing 24h % change. Click any timeframe header → opens a timeframe picker to swap columns
Alerts
When any cell exceeds a configurable threshold (e.g., ±60%), plays an alert sound
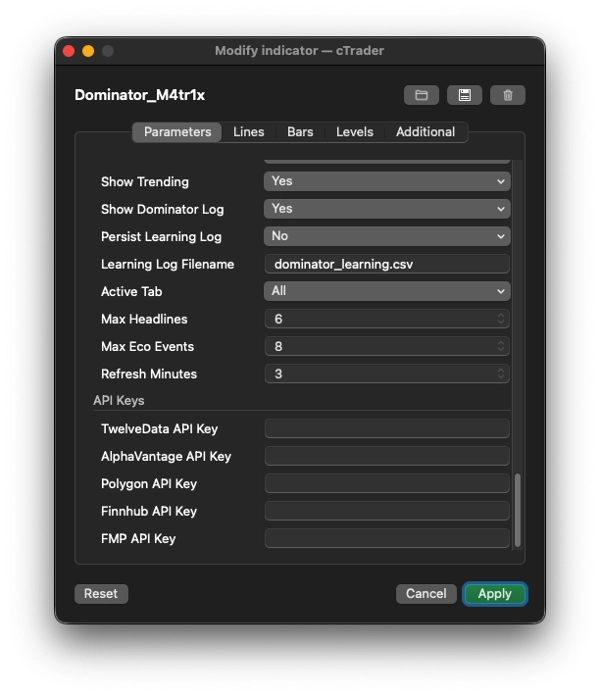
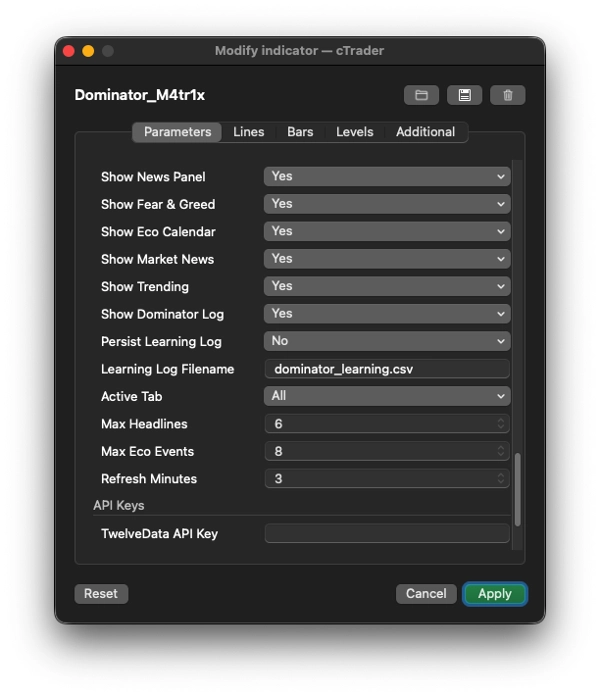
4. 📰 NEWS + INFORMATION PANELS
Economic Calendar
Aggregates upcoming high/medium-impact economic events from 8+ redundant sources:
- ForexFactory (JSON + XML), TradingView, Finnhub, TradingEconomics, MQL5, FXStreet, FMP (FinancialModelingPrep)
- Color-coded by urgency (red = NOW, orange = <15 min, yellow = <1 hour, green = later)
Market News Headlines
Aggregates from 12+ RSS/API sources:
- Crypto: CryptoCompare, CoinDesk, CoinTelegraph, NewsBTC, Binance announcements, OKX system status
- Forex: FXStreet, ForexLive
- Indices/Stocks: MarketWatch, CNBC, Reuters, Yahoo Finance
- Auto-categorizes headlines (crypto/forex/metals/energy/stocks) by keyword detection
- Filterable by tab (All, Forex, Crypto, Metals, Indices, Stocks, Energy, Economic)
Fear & Greed Index
- Fetches the Crypto Fear & Greed Index (alternative.me API, with CNN Business fallback)
- Shows numeric value (0–100), label (Extreme Fear → Extreme Greed), color bar, and 7-day sparkline history (▁▂▃▄▅▆▇█)
Trending
- Fetches top crypto movers from Binance 24hr ticker (top 5 gainers + top 5 losers)
- Falls back to CoinGecko trending or CoinPaprika
5. 📝 DOMINATOR LOG + LEARNING SYSTEM
- Keeps a running signal log showing the last 8 signals with status (● active, ✓ confirmed, ✗ invalidated)
- Tracks overall accuracy statistics (total signals, confirmed fills, invalidations, accuracy %)
- Optional CSV persistence: writes every signal event (new/confirm/invalid) to a CSV file (
dominator_learning.csv) with full metadata — designed to feed into future machine learning or backtesting
6. 🛠 Technical Architecture Highlights
- Fully overlay (
IsOverlay = true) — draws on the price chart, not a separate panel - AccessRights = None — runs in the broker's sandbox (no file system / network access beyond what cAlgo allows)
- Asynchronous data fetching — all HTTP calls run on background threads via
Task.Run()to never block the chart - Intelligent caching — symbol resolution, external OHLC data, ticker prices, and trend percentages are all cached with configurable refresh intervals
- Auto-retry — failed symbol resolutions and external data fetches retry every 45 seconds
- Collapsible sections — each panel section (Matrix, Fear & Greed, News, Trending, Log) can be collapsed/expanded by clicking its header
In Summary
Dominator M4tr1x is an Informative indicator that replaces an entire trading dashboard. It maps smart-money structure on the chart (BOS, CHoCH, FVGs, sweeps, consolidation), scores multi-asset/multi-timeframe sentiment via technical indicators, aggregates economic calendars and market news from 20+ sources, tracks Fear & Greed, shows trending assets, logs all its own signals with accuracy tracking, and lets you interactively swap symbols and timeframes — all while fetching missing data from 5+ external exchange APIs in the background.
Summary
Customer reviews
5 | 0 % | |
4 | 100 % | |
3 | 0 % | |
2 | 0 % | |
1 | 0 % |


!["[CB] Pivot Points Pro" logo](https://cdn.ctrader.com/image/webp/43463c82-67b0-4f10-a4ba-901bba091d81_32594)


