

present
Sign up and get $50 off your first purchase
Trading product for CRT+ICT_KillZones Indicator Fair Value Gap Key Levels, image 1
CRT+ICT_KillZones
Indicator
Version 1.0, Aug 2026
Windows, Mac
Reviews: 1
Trading product for CRT+ICT_KillZones Indicator Fair Value Gap Key Levels, image 2
Trading product for CRT+ICT_KillZones Indicator Fair Value Gap Key Levels, image 3
Since 13/12/2025

Description

Feature-by-Feature Breakdown

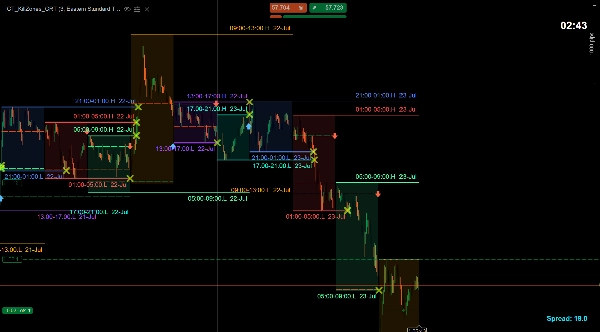
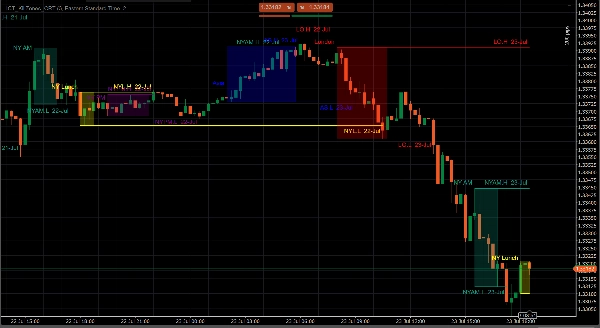
① ICT Killzones (Session Boxes) The engine of the indicator. It draws transparent colored boxes over the four high-probability trading windows defined by ICT:

  • Asian Killzone — quiet accumulation, sets the weekly range
  • London Open — high-volatility expansion, most daily moves originate here
  • New York AM — second major expansion, overlaps London close
  • New York PM — lower-conviction, trap-heavy session Each box marks the session's High and Low as horizontal pivot lines. Price that sweeps these pivots and reverses is a core ICT entry signal.

② Killzone Divisions Each session box can be split into up to 6 sub-divisions — creating equilibrium levels (50%) and quadrant levels (25/75%) inside the session. These act as magnet targets for price.

③ Killzone Mitigation (Cross + Glow) When price sweeps back through a session pivot, a visual glow pulse fires at that level — alerting the trader that a mitigation is in progress. Cross markers are drawn permanently at the sweep candle.

④ Fair Value Gaps (FVG / IFVG) Automatically detects and draws FVG rectangles on every timeframe:

  • 🟩 Bullish FVG — three-candle imbalance where price left unfilled buy-side liquidity
  • 🟥 Bearish FVG — sell-side imbalance
  • IFVG — an FVG that has been mitigated and inverted (now acts as opposing magnet) FVGs are the single most-used ICT entry model — having them auto-drawn saves critical seconds during fast price action.

⑤ High/Low Ranges (10 configurable levels) Up to 10 named range levels can be drawn simultaneously:

  • Previous Day High/Low
  • Previous Week High/Low
  • Previous Month High/Low
  • Daily/Weekly/Monthly opens
  • NDOG (New Day Opening Gap) / NWOG (New Week Opening Gap) Each level is independently colored and styled, giving the chart a full premium/liquidity map.

⑥ 1H & 4H Session H/L Hourly and 4-hour session highs and lows plotted as clean horizontal lines — the most granular structural reference levels used for intraday scalps.

⑦ Candle Timer A live countdown showing seconds until the current candle closes — essential for avoiding entries right before a close invalidates the setup.

⑧ Live Spread Display Floating spread display with custom color, font, and corner position. Shows the real-time bid/ask spread so traders know their cost before entry.

⑨ Alerts System Price alerts that fire when levels are swept, so the trader doesn't need to watch the chart constantly.

Summary

AI summary
CRT+ICT_KillZones is a professional-grade cTrader indicator designed for traders using the Inner Circle Trader (ICT) methodology. It visually highlights four key high-probability trading sessions—Asian Killzone, London Open, New York AM, and New York PM—by drawing transparent colored boxes marking each session's high and low pivot levels. These session boxes can be subdivided into equilibrium and quadrant levels to identify price magnet targets.

The indicator features a mitigation alert system that visually signals when price sweeps back through session pivots, aiding in trade timing. It automatically detects and displays Fair Value Gaps (FVGs) across all timeframes, distinguishing bullish, bearish, and mitigated/inverted FVGs, which are critical ICT entry signals.

Additional functionalities include plotting up to 10 configurable high/low range levels such as previous day, week, and month highs/lows and opens, as well as New Day and New Week Opening Gaps. Hourly and 4-hour session highs and lows are also marked for granular intraday reference.

A candle timer shows the countdown to the current candle close, and a live spread display provides real-time bid/ask spread information. The indicator includes an alert system that notifies traders when key levels are swept, reducing the need for constant chart monitoring.
Indicator profile

Customer reviews

5.0
Reviews: 1
5
100 %
4
0 %
3
0 %
2
0 %
1
0 %
Customer reviews
August 22, 2026
CRT+ICT_KillZones is a capable ICT session-mapping tool with configurable Asia, London, NY AM, NY Lunch and NY PM zones plus persistent session High/Low liquidity levels. Testing on EURUSD and XAUUSD confirmed stable operation across M1 and H1, with particularly clear visualization on lower intraday timeframes. H1 charts can become somewhat crowded when multiple historical labels overlap, while D1 offers limited practical value for intraday Killzones.

Discussion

FAQ

Fair Value Gap
Key Levels
BOS
Liquidity Sweep
CHOCH
Inducement
Liquidity Grab
Products available through cTrader Store, including trading bots, indicators and plugins, are provided by third-party developers and made available for informational and technical access purposes only. cTrader Store is not a broker and does not provide investment advice, personal recommendations or any guarantee of future performance.

You may also like

"ORB v1" logo
Popular
5.0
(3)
$19
Indicator
Breakout
Opening Range Breakout (ORB) - Visual Edition
Indicator
ATR
MSS
+5
Grades ICT Unicorn setups (Breaker Block + FVG confluence) into PRIME / SETUP / WATCH, with retest & RR targets.
Indicator
Key Levels
Market Structure
+1
Sessions, ICT killzones, multi-ORB and previous levels. One clean, no-repaint cTrader overlay.
Indicator
Key Levels
Order Block
+5
Pixel-perfect trading zones in a click! Instantly draw, resize & color via hotkeys. Automate your charting routine
Indicator
Doji
Engulfing
+3
Multi Timeframe OHLC levels (daily, weekly, and monthly), with a two-day price action bias dashboard
Indicator
Prop
Forex
+10
IBS Indicator – Measures price position within bars for smarter trades. Works on all markets & timeframes.
Indicator
AI
ATR
+26
SMC without the mess: Clean structure + auto-managing FVGs + MTF panel. Hard-right-edge, step size-based for any symbol.
Indicator
Support & Resistance
Detects Gartley, Bat, Butterfly, Crab, Shark & Cypher patterns and backtests each one's real win rate.
Indicator
Prop
Forex
+7
The Parabolic SAR, or "Stop and Reverse," is a dynamic technical analysis tool.
Indicator
Breakout
FlexSR auto‑detects pivot highs/lows to plot dynamic support & resistance lines Features customizable styling and option
Indicator
ATR
EMA
+5
The indicator displays potential reversal zones (support/resistance) on the chart based on the average range (High–Low)
Indicator
Signal
Supertrend
Multi-symbol multi-timeframe SuperTrend panel with watchlist, one-click jump, and alerts.
Indicator
ATR
Forex
+5
Most used candle patterns. (1 candle, 2 candles and 3 candles patterns) and Marubozu. Bonus Fibo Risk control.
Indicator
Prop
Forex
+5
Traders Panel: Scan 15 pairs across 5 timeframes. Live heatmap, strength rankings and best setups in one panel.
Indicator
AI
ATR
+25
On-chart draggable panel to show/hide Positions & Pending Orders with fixed warning banner and inline alerts per symbol.
Indicator
Volume
Imbalance
+5
Spot Institutional Order Flow with Proportional Volume Bubbles & Integrated Cumulative Volume Delta (CVD) Intelligence.
Indicator
ATR
SMC
+2
Auto Fibonacci Retracement Pro – Smart Swing & Golden Zone Levels
Indicator
ATR
RSI
+14
A metric that can set 1 to 3 groups of Bollinger Bands

Price

Since 13/12/2025

















