
IR Moving Average
Indikator
258 muat turun
Versi 1.0, Jan 2025
Windows, Mac
5.0
Ulasan: 1
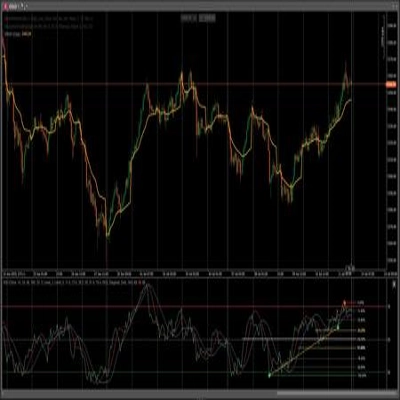
Penerangan
pergerakan ini merangkumi segala yang diperlukan oleh seorang pedagang daripada Purata Pergerakan.
JenisHarga: Buka,Tutup,Tinggi,Rendah, Median,Tipikal,Berwajaran
Menyokong semua jenis purata pergerakan.
Ringkasan
Ringkasan AI
IR Moving Average is a comprehensive moving average indicator designed to meet traders' needs. It supports all types of moving averages and allows calculation based on various price types, including Open, Close, High, Low, Median, Typical, and Weighted prices. This flexibility enables users to tailor the indicator to different trading strategies and market conditions.
Profil indikator
Ulasan pelanggan
5.0
Ulasan: 1
5 | 100 % | |
4 | 0 % | |
3 | 0 % | |
2 | 0 % | |
1 | 0 % |
Ulasan pelanggan
August 12, 2025
Pros: Flexible moving average with multiple calculation methods, lightweight, stable on all timeframes. Cons: No alerts, no MTF mode, no preset saving.
Perbincangan
Soalan Lazim
Produk yang tersedia melalui cTrader Store, termasuk bot dagangan, indikator dan plugin, disediakan oleh pembangun pihak ketiga dan diberikan akses untuk tujuan maklumat dan teknikal sahaja. cTrader Store bukan broker dan tidak memberikan nasihat pelaburan, syor peribadi atau sebarang jaminan prestasi masa hadapan.
Lebih banyak produk daripada penulis ini


Harga
5.12K
Pemasangan percuma