
Institutional Volume Supply Demand
Indicador
1.51K transferências
Versão 1.0, Sep 2025
Windows, Mac
4.4
Avaliações: 5
Descrição
Zonas do Perfil de Volume (Oferta/Demanda)
O indicador Zonas do Perfil de Volume fornece uma visão institucional da estrutura do mercado aproveitando a análise de Volume ao Preço . Ele identifica automaticamente níveis de Suporte e Resistência de alta probabilidade com base em ineficiências do mercado e vazios de liquidez.
Principais Características:
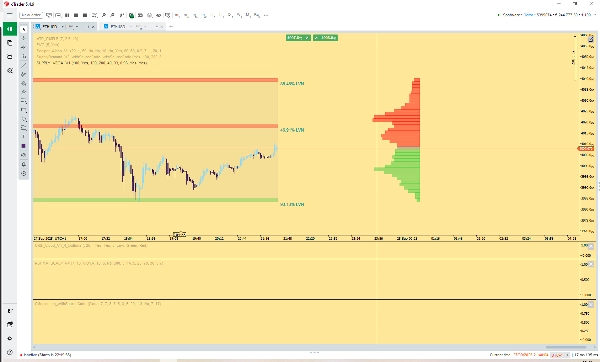
- S&R Institucional (LVNs): Calcula e marca automaticamente Nós de Baixo Volume (LVNs)—áreas onde o preço se moveu rapidamente com volume mínimo de negociação. Esses LVNs atuam como zonas futuras de Oferta (Resistência) e Demanda (Suporte) de alta convicção.
- Retrospectiva Dinâmica: O perfil ajusta automaticamente seu período de análise para focar apenas no movimento ou tendência principal atual, reiniciando após um pivô significativo do mercado.
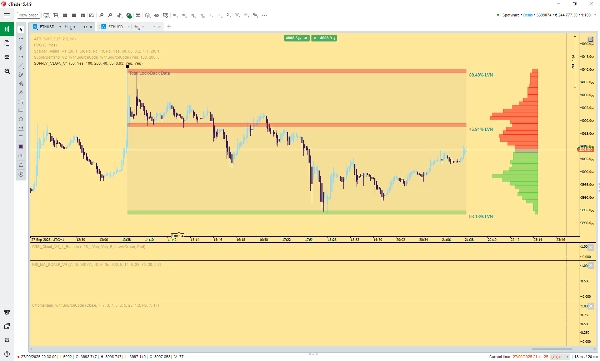
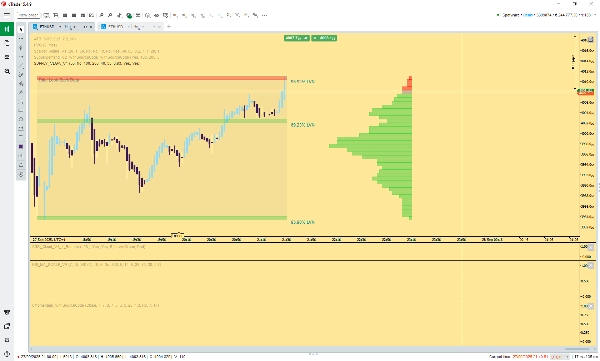
- Coloração Relativa ao Preço: O histograma visível do Perfil de Volume e as zonas correspondentes de Oferta/Demanda são coloridos dinamicamente com base no preço atual:
-
- Verde: Áreas de volume abaixo do preço atual (atuando como Demanda/Suporte).
- Vermelho: Áreas de volume acima do preço atual (atuando como Oferta/Resistência).
- Força do LVN: As zonas são rotuladas com uma porcentagem indicando a fraqueza do volume naquele nível, fornecendo uma medida objetiva da força teórica da zona (tamanho do vazio de liquidez).
Esta ferramenta é essencial para traders que utilizam técnicas avançadas de estrutura de mercado, fluxo de ordens ou Perfil de Volume para identificar pontos-chave de interesse e antecipar reversões do mercado.
Resumo
Resumo de IA
The Institutional Volume Supply Demand indicator offers an advanced market structure analysis using Volume Profile Zones based on Volume at Price data. It automatically identifies key Support and Resistance levels by detecting Low Volume Nodes (LVNs), which represent areas where price moved rapidly with minimal trading volume, indicating potential future supply (resistance) and demand (support) zones. The indicator dynamically adjusts its look-back period to focus on the current major swing or trend, resetting after significant market pivots. It visually distinguishes supply and demand zones with color coding: green for volume areas below the current price (demand/support) and red for areas above (supply/resistance). Each LVN is labeled with a percentage that quantifies the weakness of volume at that level, providing an objective measure of zone strength based on liquidity void size. This tool supports traders employing advanced techniques such as order flow and Volume Profile analysis to identify high-probability market turning points. It is applicable across various markets including Forex pairs (e.g., EURUSD, GBPUSD, NZDUSD, USDJPY), cryptocurrencies (BTCUSD), indices (NAS100), and commodities (XAUUSD).
Perfil do indicador
Avaliações de clientes
4.4
Avaliações: 5
5 | 80 % | |
4 | 0 % | |
3 | 0 % | |
2 | 20 % | |
1 | 0 % |
Avaliações de clientes
May 15, 2026
CTrader's recent update has made this indicator obsolete. It simply stops CTrader from working. this Indicator needs an update to correlate with the Ctrader update.
April 8, 2026
November 3, 2025
Excelente indicador para quem opera baseado em zonas de liquidez, oferta e demanda institucional. Ótimo trabalho!
Conversa
Perguntas frequentes
BTCUSD
Forex
Signal
Breakout
EURUSD
GBPUSD
NZDUSD
Bollinger
Fibonacci
ZigZag
Scalping
Fair Value Gap
SMC
Grid
AI
XAUUSD
NAS100
MACD
USDJPY
VWAP
Os produtos disponíveis através da cTrader Store, incluindo bots de negociação, indicadores e plugins, são fornecidos por programadores terceiros e são disponibilizados apenas para fins informativos e de acesso técnico. A cTrader Store não é um corretor e não fornece aconselhamento em matéria de investimento, recomendações pessoais ou qualquer garantia de desempenho no futuro.


Preço
Desde 09/01/2025
11.78K
Instalações gratuitas