
Squeeze Momentum Indicator 2.0version
지표
54 다운로드
버전 1.0, Nov 2025
Windows, Mac
설명
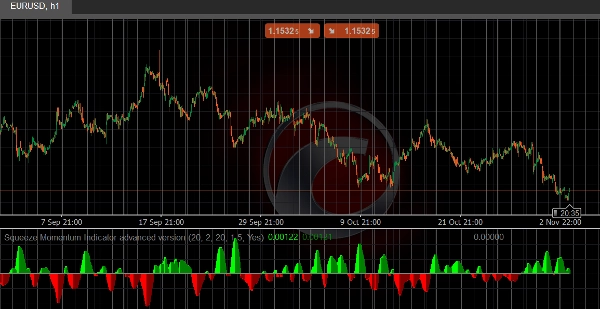
이 cTrader 지표는 인기 있는 스퀴즈 모멘텀 전략을 구현하여 저변동성 통합 기간과 잠재적 돌파 기회를 식별하도록 설계되었습니다.
작동 원리:
- 볼린저 밴드와 켈트너 채널을 비교하여 변동성 "스퀴즈" 상태를 감지합니다
- 선형 회귀 계산을 사용하여 모멘텀 강도를 측정합니다
- 색상 코드 히스토그램과 동적 제로 라인을 통해 명확한 시각적 신호를 제공합니다
주요 특징:
🎯 스퀴즈 감지 - 볼린저 밴드가 켈트너 채널 내부로 이동할 때(스퀴즈)와 확장될 때(돌파)를 식별합니다
📊 모멘텀 측정 - 히스토그램이 현재 모멘텀 강도와 방향을 표시합니다
🎨 시각적 신호:
- 라임/녹색 막대: 강세 모멘텀 (강화/약화)
- 빨강/마룬 막대: 약세 모멘텀 (강화/약화)
- 파랑/검정/회색 제로 라인: 스퀴즈 없음/스퀴즈 활성/스퀴즈 해제
사용자 정의 가능한 매개변수:
- BB 길이 및 배수
- KC 길이 및 배수
- 켈트너 채널 계산을 위한 TrueRange 옵션
적합한 용도:
- 통합 돌파 탐지
- 저변동성 기간 동안 진입 타이밍
- 모멘텀 방향 확인
- 스윙 트레이딩 및 포지션 트레이딩
요약
지표 프로필
고객 리뷰
0.0
리뷰: 0
고객 리뷰
이 상품에 대한 리뷰가 아직 없습니다. 이미 사용해 보셨나요? 다른 사람들에게 가장 먼저 소개해 주세요!
상담
자주 묻는 질문(FAQ)
Prop
Forex
Breakout
Indices
Commodities
Crypto
Stocks
Bollinger
트레이딩 봇, 지표, 플러그인 등 cTrader Store에서 제공되는 상품은 제3자 개발자에 의해 제공되며, 이는 단순히 정보 및 기술적 접근을 목적으로 제공된 것입니다. cTrader Store는 중개인이 아니며, 투자 조언, 개인별 추천 또는 향후 성과에 대한 어떠한 보장도 제공하지 않습니다.
이 작성자의 상품 더 보기


가격
10M
거래량
10.64K
핍 수익
23
판매
1.23K
무료 설치