
Descrição
🚀 Mais de 10.000 traders já usam nossos PRINCIPAIS indicadores🏆
Descubra por que os profissionais nos escolhem – as ferramentas mais poderosas no cTrader (indicadores, algoritmos e cBots) estão esperando por você.
👉 Obtenha todos os nossos sistemas TOP aqui:
_______________________________________________
📌 Indicadores de Estrutura de Mercado
· ✅ AdvancedMarket Structure: Bos, Choch, SwinLevels, Order Blocks, Market Structure& Liquidity Finder
· 🔄 Análise Dinâmica da Estrutura de Mercado de Pontos de Virada
· 🧱 Bloco de Ordem
· ⛓️ BOS & CHOCH
· 🧠 ICT Power of 3
· 🌀 Zonas de Polaridade de Mercado
_______________________________________________
🔚 Sistemas Inteligentes de Saída
· 📍 Algoritmo Inteligente de Trailing
_______________________________________________
📐 Indicadores ZigZag
· 🔍 Projeção de Liquidez de Preço ZigZag
· ➖ ZigZag
· 🎯 Rastreador de Extremos Zig-Zag
_______________________________________________
🧱 Indicadores de Suporte e Resistência
· 🟩 Linhas de Suporte e Resistência SmartTrend
· 🧱 Todos os Níveis de Suporte e Resistência
_______________________________________________
📊 Indicadores de Tendência e Canal
· 🔄 Canal de Tendência Automático
· 📊 Supertrend
· ⚡Analisador de Tendência Momentum
· 🧠 Canal de Tendência Adaptativo
· 💥 Sistema de Rompimento de Canal
· 🌈 Gradiente Dinâmico de Tendência
_______________________________________________
💧 Ferramentas de Volume e Liquidez
· 📉 Mapa de Liquidação de Alavancagem
· 🔍 Gap de Valor Justo Momentum
· 🕒 Sessões de Gap de Valor Justo
_______________________________________________
⚡ Indicadores de Momentum e RSI
· 🚀 Momentum de Alcance Dinâmico
· 🔎 Viés de Velas Multi-Nível
Rastreador
_______________________________________________
🔮 Ferramentas de Previsão e Projeção
· 📐 Previsão Baseada em Linreg& ATR
· 📏 Regressão Linear Fibonacci Multi-tempo
· 📈 Projetor de Fluxo de Mercado Alimentado por Volume
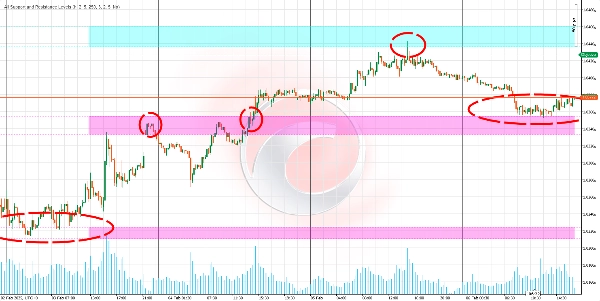
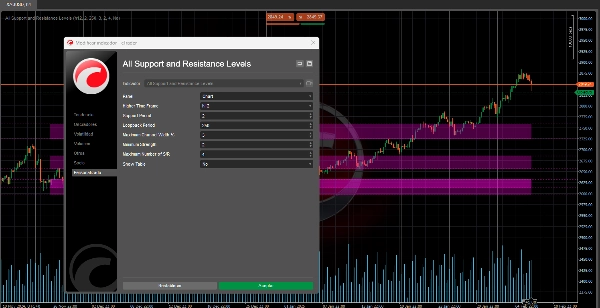
Este algoritmo é um indicador avançado de suporte e resistência projetado para ajudá-lo a identificar níveis-chave no mercado.
Sua principal vantagem é que permite visualizar níveis de suporte e resistência de qualquer período de tempo (como diário, semanal ou mensal) diretamente no gráfico que você está analisando, mesmo que seja em um período diferente (por exemplo, 15 minutos ou 1 hora). 📊⏰
Para que serve? 🎯
Identificar zonas-chave do mercado:
- Detectar níveis onde o preço pode parar, reverter ou romper com força. 🛑↗️↘️
- Ajuda você a tomar decisões mais informadas sobre entradas, saídas e stop-loss. 💡📈📉
Analisar múltiplos períodos de tempo sem trocar de gráfico:
- Visualizar níveis importantes de períodos maiores (como diário ou semanal) enquanto negocia em períodos menores (como 15 minutos ou 1 hora). 🕒📅
- Oferece uma visão mais ampla do mercado sem precisar trocar constantemente de gráfico. 🌍🔍
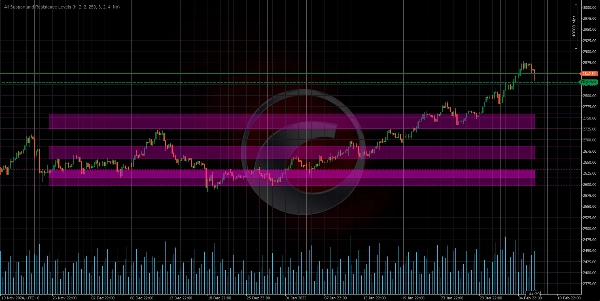
Priorizar níveis significativos:
- O indicador classifica os níveis de suporte e resistência com base em sua "força", ou seja, com que frequência o preço interagiu com eles no passado. 💪📊
- Isso ajuda você a focar nos níveis mais relevantes e confiáveis. 🎯✅
Como funciona a lógica? 🧠⚙️
Coleta de Dados:
- O indicador pega os preços máximos e mínimos de um período específico (diário, semanal, etc.). 📈📉
- Esses dados são usados para buscar padrões-chave no comportamento do preço. 🔍📊
Detecção de pontos-chave (pivôs):
- Identifica máximas e mínimas locais — pontos onde o preço atingiu um pico ou vale em comparação com preços próximos. ⛰️🌄
- Esses pontos são candidatos a se tornarem níveis de suporte ou resistência. 🎯📌
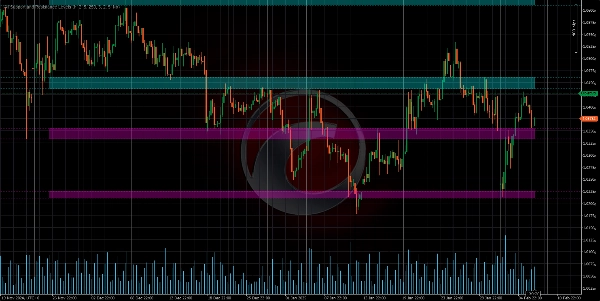
Agrupamento de níveis:
- Níveis próximos são agrupados para formar zonas de suporte ou resistência, em vez de linhas exatas. 🟦🟧
- Isso reflete a ideia de que suporte e resistência são áreas, não pontos precisos. 📏🎯
Cálculo da força do nível:
A "força" de um nível é determinada por dois fatores:
- Frequência de toques: Quantas vezes o preço tocou ou chegou perto desse nível no passado. 🔄📊
- Agrupamento de pontos-chave: Quantas máximas ou mínimas estão próximas desse nível. 🔗📈
Níveis com maior força são considerados mais significativos. 💪🎯
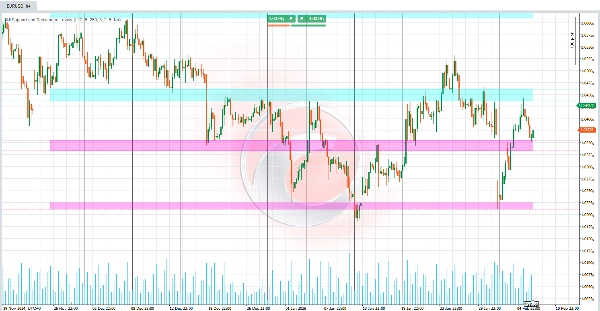
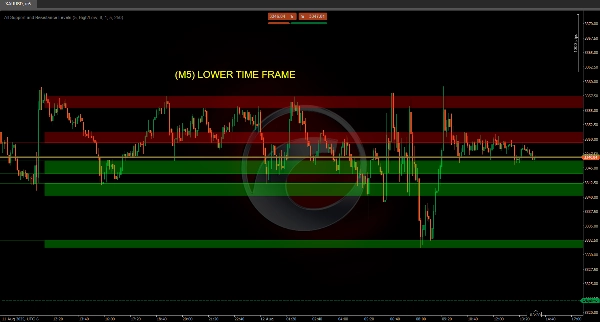
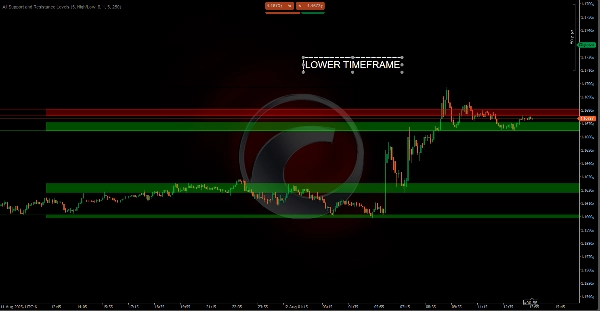
Visualização no gráfico:
- Níveis são desenhados como linhas horizontais ou zonas coloridas no gráfico. 🎨📊
- A cor de cada nível depende da posição atual do preço:
-
- Resistência: Se o preço estiver abaixo do nível. 🔴
- Suporte: Se o preço estiver acima do nível. 🟢
- Dentro do intervalo: Se o preço estiver dentro do intervalo do nível. 🟡
Como você pode visualizar diferentes períodos de tempo no seu gráfico? 🕒📊
Suporte e resistência de períodos maiores em gráficos de períodos menores:
- Por exemplo, se você estiver analisando um gráfico de 15 minutos, o indicador pode mostrar níveis-chave do período diário ou semanal. 🕒📅
- Isso permite ver níveis importantes de contexto maior sem sair do gráfico atual. 🌍🔍
Suporte e resistência de períodos menores em gráficos de períodos maiores:
- Embora menos comum, você também pode visualizar níveis de períodos menores (como 1 minuto ou 5 minutos) em gráficos de períodos maiores (como diário ou semanal). 🕒📅
- Isso pode ser útil para análises mais detalhadas dentro de um contexto mais amplo. 🔍📊
Resumo
The indicator analyzes price data by collecting highs and lows from specified timeframes, identifying local pivot points where price peaks or valleys occur. These points are grouped into zones representing support or resistance areas rather than precise lines. Each level is assigned a strength score based on the frequency of price touches and the clustering of key points, helping users prioritize the most significant and reliable levels.
Visualized on the chart as horizontal lines or colored zones, the indicator uses color coding to indicate the price's position relative to each level: red for resistance (price below level), green for support (price above level), and yellow when price is within the level’s range. This tool assists traders in making informed decisions on entries, exits, and stop-loss placements by highlighting where price may stop, bounce, or break with strength.
Avaliações de clientes
5 | 50 % | |
4 | 0 % | |
3 | 0 % | |
2 | 0 % | |
1 | 50 % |


![Logótipo de "[Hamster-Coder] Bollinger Bands"](https://cdn.ctrader.com/image/webp/21d8e5d6-fb11-4bac-b9ee-cd05c2b76804_30327)


