
Descrição
💡 Canais de Regressão Linear e Pontos ZigZag 💡
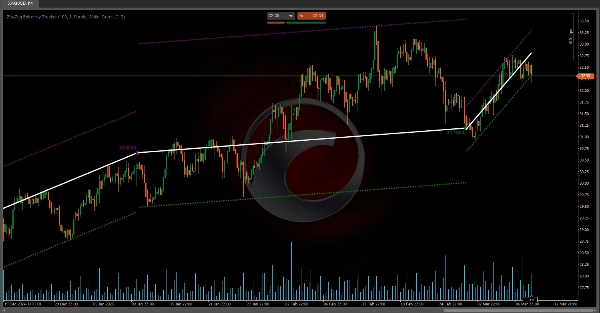
• Os canais de regressão linear são recalculados e redefinidos cada vez que o preço ultrapassa os limites esperados (bandas), garantindo que a medição permaneça atualizada com a tendência real do mercado.
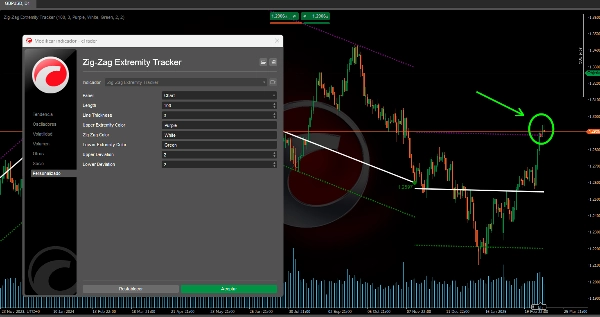
• Os pontos marcados (círculos) representam extremos (máximos e mínimos) que servem de base para desenhar o ZigZag e determinar de onde os canais são calculados.
• Esta abordagem dinâmica permite uma melhor visualização de potenciais mudanças de tendência, bem como áreas de sobreextensão ou sobrevenda onde o preço pode reverter em direção à média.
❓ Como os canais se relacionam com o ZigZag e os pontos extremos? ❓
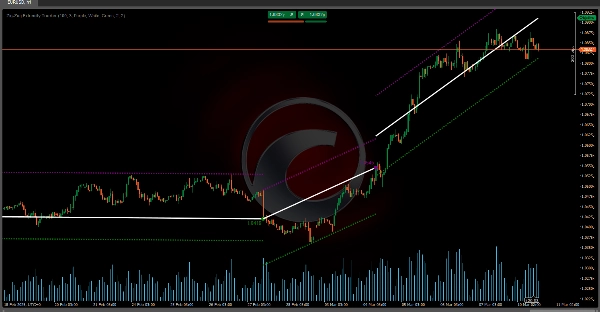
• Sempre que um novo extremo (máximo ou mínimo) é detectado, o indicador não apenas plota um círculo e a linha ZigZag conectando esse ponto ao anterior, mas também reajusta o potencial canal de regressão linear sendo desenhado a partir desse último extremo.
• Se, durante as barras seguintes, o preço permanecer dentro das bandas, o canal permanece ativo e se estende até a barra atual.
• Se em algum momento o preço romper essas bandas, o indicador “assume” que o canal foi invalidado e inicia um novo a partir da barra onde ocorreu a quebra.
Indicadores da Ctrader Store:
Dynamic Market Structure
Analysis of Turning Points
Fibonacci Linear
Regression Multi-timeframe
Multi-Level Candle Bias
Tracker
Auto Support and
Resistance Trend Lines
All Support and
Resistance Levels
Dynamic Market Structure Analysis of Turning Points
Fibonacci Linear Regression Multi-timeframe
Multi-Level Candle Bias Tracker
Auto Support and Resistance Trend Lines
Resumo
Avaliações de clientes
5 | 50 % | |
4 | 50 % | |
3 | 0 % | |
2 | 0 % | |
1 | 0 % |


