
Higher TimeFrame Candle Tracker
Indicador
1 compras
Versão 1.0, Oct 2025
Windows, Mac
Descrição
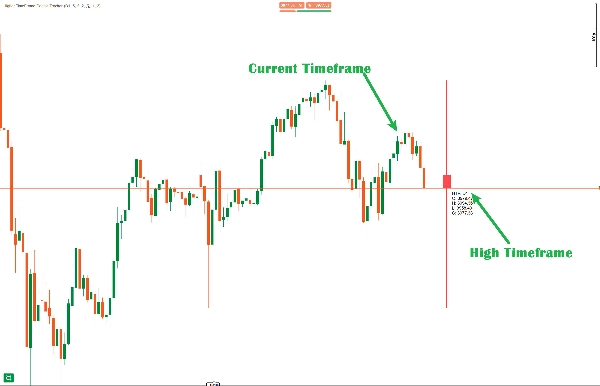
O rastreador de velas de Timeframe Superior é usado para obter uma visão do que a vela do timeframe superior selecionado é como.
Principais Características:
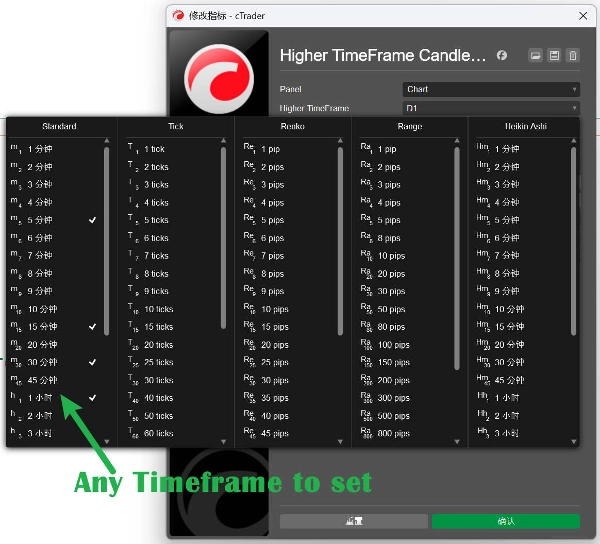
- Seleção de Timeframe Personalizável - Escolha qualquer timeframe superior (Diário, Semanal, Mensal, etc.)
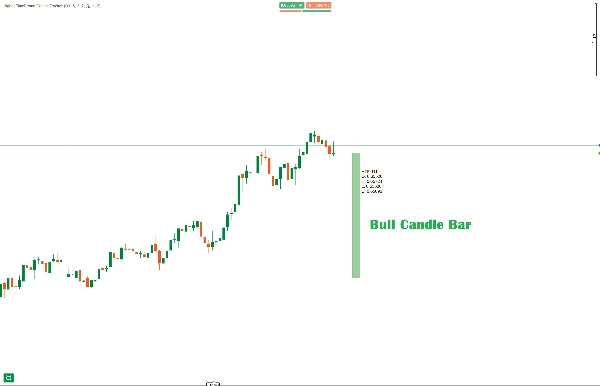
- Exibição Visual da Vela - A vela HTF atual é plotada com pavios e corpo adequados, deslocada da ação de preço atual
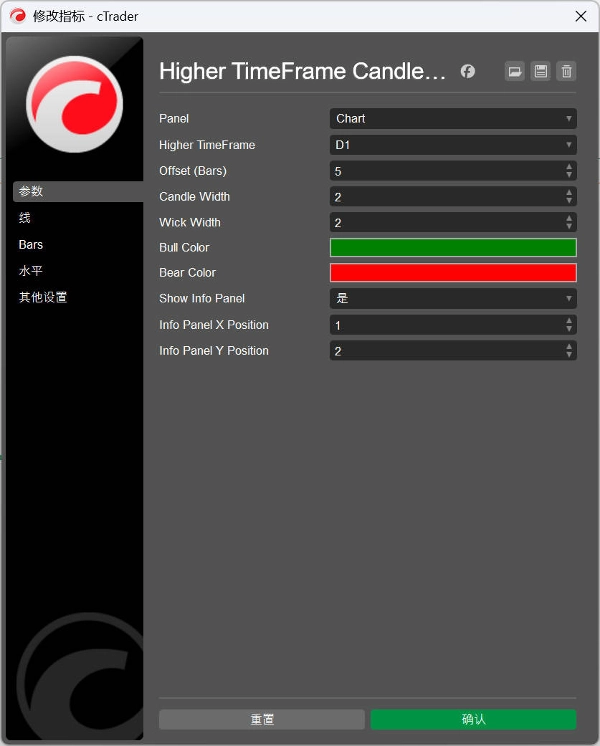
Configurações Ajustáveis:
- Deslocamento: Distância em barras a partir do preço atual (padrão: 5)
- Largura da Vela: Espessura do corpo da vela (1-10, padrão: 3)
- Largura do Pavio: Espessura das linhas do pavio (1-5, padrão: 1)
- Cores: Cores personalizáveis para alta (verde) e baixa (vermelho)
TimeFrame Suportado:
- Minute, Minute2, Minute3, Minute4, Minute5
- Minute10, Minute15, Minute30, Minute45
- Hour, Hour4, Hour12
- Daily, Day2, Day3
- Weekly, Monthly
Tabela de Informações - Exibe dados em tempo real da vela HTF: valores de Abertura, Máxima, Mínima, Fechamento.
中文说明:
可自定义参数:
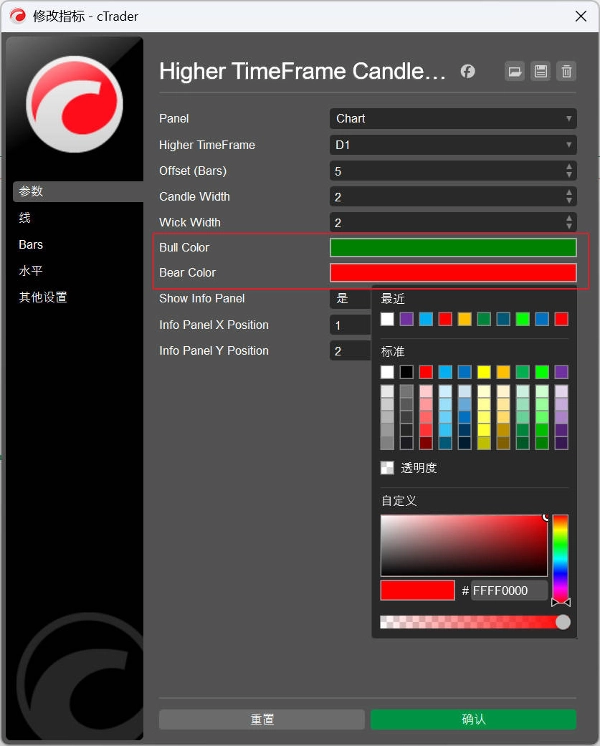
- Higher TimeFrame(高时间框架) - 选择要跟踪的时间框架(默认:Daily)
- Offset(偏移量) - K线距离当前价格的位置(默认:5根K线)
- Candle Width(K线宽度) - K线实体的宽度(1-10,默认:3)
- Wick Width(影线宽度) - 影线的宽度(1-5,默认:2)
- Bull Color(看涨颜色) - 看涨K线颜色(默认:Green)
- Bear Color(看跌颜色) - 看跌K线颜色(默认:Red)
- Show Info Panel(显示信息面板) - 是否显示HTF数据面板(默认:true)
核心特性:
- 实时HTF K线显示 - 在图表上绘制当前高时间框架K线
- 完整的K线结构 - 包含实体、上影线和下影线
- 颜色区分 - 自动根据涨跌使用不同颜色
- 信息面板 - 显示Open、High、Low、Close和方向指示
- 自适应填充 - 看涨K线半透明,看跌K线较深
支持的时间框架:
- Minute, Minute2, Minute3, Minute4, Minute5
- Minute10, Minute15, Minute30, Minute45
- Hour, Hour4, Hour12
- Daily, Day2, Day3
- Weekly, Monthly
Resumo
Perfil do indicador
Avaliações de clientes
0.0
Avaliações: 0
Avaliações de clientes
Ainda não há avaliações para este produto. Já o experimentou? Seja o primeiro a contar a outras pessoas!
Conversa
Perguntas frequentes
Prop
Forex
Breakout
Indices
Commodities
Crypto
Stocks
Os produtos disponíveis através da cTrader Store, incluindo bots de negociação, indicadores e plugins, são fornecidos por programadores terceiros e são disponibilizados apenas para fins informativos e de acesso técnico. A cTrader Store não é um corretor e não fornece aconselhamento em matéria de investimento, recomendações pessoais ou qualquer garantia de desempenho no futuro.


Preço
Desde 30/09/2024
44
Vendas