
Descrição
Ordem de Cluster de Liquidez (LCO) 🔍💧
1. O que o LCO mostra
Ordem de Cluster de Liquidez detecta e desenha automaticamente:
- Clusters de liquidez altista (zonas potenciais de demanda / acumulação) ✅
- Clusters de liquidez baixista (zonas potenciais de oferta / distribuição) 🔻
Cada cluster é:
- ancorado em uma barra pivô de volume (um máximo local de volume),
- classificado como altista ou baixista com base na recente extensão do preço,
- estendido para frente no tempo até que o preço mitigue (consuma) o cluster.
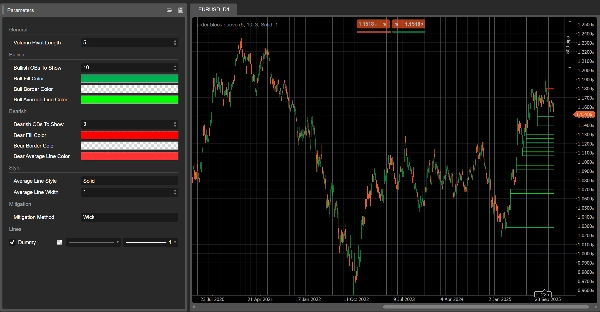
No gráfico você vê:
- Retângulos verdes → clusters de liquidez altista
- Retângulos vermelhos → clusters de liquidez baixista
- Uma linha cinza dentro de cada retângulo → o nível médio de preço daquele cluster
Uma vez que um cluster é considerado mitigado, ele desaparece do gráfico e apenas clusters ativos permanecem.
2. Lógica de detecção (em termos simples)
- Pivô de volume
-
- O LCO procura barras onde o volume é maior do que as barras anteriores e seguintes de
Volume Pivot Length. - Essas barras são pivôs de volume – âncoras potenciais para clusters de liquidez.
- O LCO procura barras onde o volume é maior do que as barras anteriores e seguintes de
- Contexto: altista vs baixista
-
- O comportamento recente do preço define um contexto:
-
- Contexto altista → a extensão para baixo dominou.
- Contexto baixista → a extensão para cima dominou.
- Esse contexto decide se o próximo pivô de volume criará um cluster de liquidez altista ou baixista.
- Cluster de liquidez altista
Em um contexto altista: -
- Fundo do cluster = mínima da barra pivô
- Topo do cluster = ponto médio da barra (
(máxima + mínima) / 2) - Interpretação: zona onde a pressão de baixa foi absorvida e os compradores entraram agressivamente.
- Cluster de liquidez baixista
Em um contexto baixista: -
- Fundo do cluster = ponto médio da barra pivô
- Topo do cluster = máxima da barra pivô
- Interpretação: zona onde a pressão de alta foi absorvida e os vendedores assumiram o controle.
- Linha média
-
- Para cada cluster, o LCO calcula a média do topo e do fundo e desenha uma linha média cinza.
- Isso atua como um nível de equilíbrio interno do cluster.
- Mitigação (consumo do cluster)
A cada nova barra, o LCO verifica se um cluster está mitigado: -
- Para clusters altistas:
-
- Ele acompanha um preço alvo para baixo nos últimos
Volume Pivot Lengthbarras: -
Método de Mitigação = Wick→ mínima mais baixa.Método de Mitigação = Close→ fechamento mais baixo.
- Se esse preço alvo ficar abaixo do fundo do cluster, o cluster altista é considerado mitigado e removido.
- Ele acompanha um preço alvo para baixo nos últimos
- Para clusters baixistas:
-
- Ele acompanha um preço alvo para cima:
-
Wick→ máxima mais alta.Close→ fechamento mais alto.
- Se esse preço alvo ficar acima do topo do cluster, o cluster baixista é mitigado e removido.
Mitigado = a liquidez naquele cluster é assumida como consumida / invalidada.
3. Como ler o LCO no gráfico
Você verá principalmente:
- Clusters verdes abaixo do preço → potenciais zonas de liquidez de demanda
- Clusters vermelhos acima do preço → potenciais zonas de liquidez de oferta
Leitura típica (não é conselho de negociação):
- Clusters recentes
-
- Clusters criados recentemente costumam ser mais relevantes:
-
- Cluster altista abaixo do preço → área onde os compradores absorveram a pressão de venda pela última vez.
- Cluster baixista acima do preço → área onde os vendedores absorveram a pressão de compra pela última vez.
- Retestes de um cluster
-
- O preço retorna a um cluster altista por cima:
-
- Se o preço reage e mantém o fundo → possível zona de reação / bounce longa.
- O preço retorna a um cluster baixista por baixo:
-
- Se o preço não consegue negociar acima do topo → possível zona de rejeição / reação curta.
- Clusters mitigados vs ativos
-
- Quando o preço atravessa um cluster além de seus limites de acordo com o método de mitigação escolhido,
→ esse cluster de liquidez é removido nas barras subsequentes. - Clusters ainda visíveis são zonas de liquidez ativas que ainda não foram totalmente negociadas.
- Quando o preço atravessa um cluster além de seus limites de acordo com o método de mitigação escolhido,
- Usando a linha média
-
- Essa linha média cinza pode ser usada como:
-
- um nível para realização de lucros ou saída parcial dentro do cluster,
- uma referência de “preço justo” dentro da zona de liquidez,
- uma maneira rápida de ver se o preço está negociando na metade superior ou inferior do cluster.
4. Parâmetros (Inglês)
Volume Pivot Length
- Barras usadas para:
-
- detectar pivôs de volume,
- calcular extremos e alvo de mitigação.
- Valores menores → mais clusters, mais ruído;
- Valores maiores → menos clusters, mais significativos.
Clusters de Liquidez Altista Para Mostrar
(antigos OBs Altistas Para Mostrar)
- Número máximo de clusters altistas exibidos no gráfico.
Clusters de Liquidez Baixista Para Mostrar
(antigos OBs Baixistas Para Mostrar)
- Número máximo de clusters baixistas exibidos.
Cor de Preenchimento Altista / Cor de Preenchimento Baixista
- Cor de preenchimento dos clusters altistas/baixistas.
- Você pode incluir valores alpha (opacidade).
Cor da Linha Média Altista/Baixista
- Cor da linha média interna para cada cluster.
Estilo da Linha Média
- Estilo visual para a linha média:
"Sólido","Tracejado","Pontilhado".
Largura da Linha Média
- Espessura da linha média.
Método de Mitigação
"Wick"→ mitigação baseada em pavios de máxima/mínima (mais sensível)."Close"→ mitigação baseada em preços de fechamento (mais conservador).
Resumo
On the chart, bullish clusters appear as green rectangles below the price, indicating areas where buyers absorbed selling pressure. Bearish clusters are shown as red rectangles above the price, marking zones where sellers absorbed buying pressure. Each cluster includes a grey mid-line representing the average price level, serving as an internal equilibrium reference.
Clusters extend forward in time until price "mitigates" or consumes them, at which point they disappear, leaving only active liquidity zones visible. Mitigation is determined by tracking price extremes (high/low wicks or closing prices) over a configurable number of bars.
Key parameters include the volume pivot length (defining sensitivity and cluster significance), maximum clusters displayed, cluster colors, mid-line style, and mitigation method. LCO supports various markets including forex, indices, commodities, stocks, and cryptocurrencies, and integrates with multiple trading strategies and indicators such as RSI, MACD, Bollinger Bands, and Fibonacci levels.
Avaliações de clientes
5 | 100 % | |
4 | 0 % | |
3 | 0 % | |
2 | 0 % | |
1 | 0 % |


![Logótipo de "Gaussian Channel [Iridio Capital]"](https://cdn.ctrader.com/image/webp/7c039209-5573-4a54-a072-f9528b503103_41960)


