
Parabolic RSI Alert V1
Indicador
3 compras
Versão 1.0, Aug 2025
Windows, Mac
4.5
Avaliações: 2
Descrição
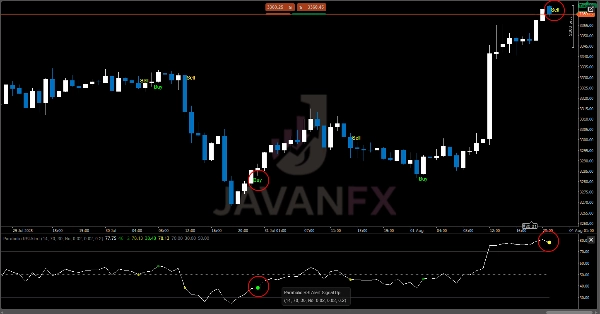
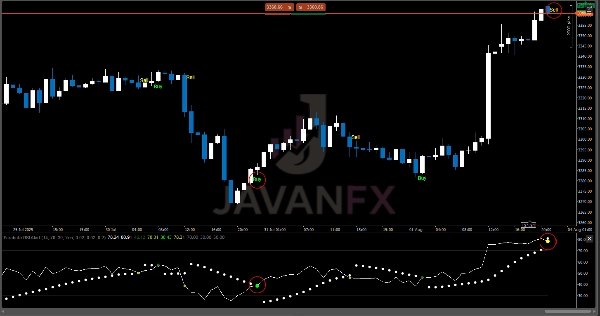
O Alerta Parabólico RSI é um indicador poderoso que combina a precisão do Índice de Força Relativa (RSI) com as capacidades dinâmicas de acompanhamento de tendência de um SAR Parabólico personalizado. Essa fusão única ajuda os traders a identificar pontos de reversão de alta probabilidade com sinais visuais claros e alertas em tempo real.
Notas de Uso:
- O indicador funciona melhor em períodos de 1H ou superiores
- Sinais fortes ocorrem quando reversões acontecem em zonas de sobrecompra/sobrevenda
- Sinais regulares aparecem quando reversões ocorrem fora das zonas extremas
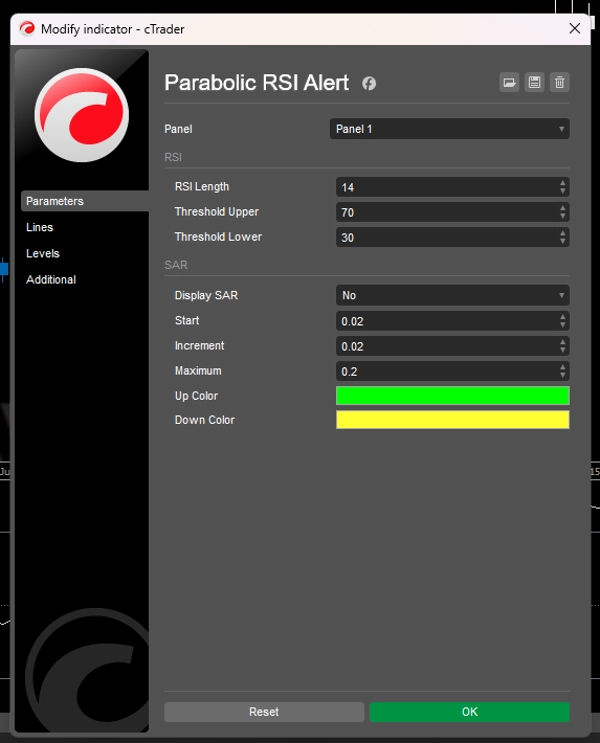
- Os pontos SAR só são plotados quando
Display SARestá ativado - Combine com ação de preço e outros indicadores para confirmar pontos de entrada e saída (Opcional).
Ideal para traders que:
- Querem reduzir o atraso na análise tradicional do RSI
- Precisam de alertas visuais e sonoros claros para entradas oportunas
- Preferem sinais mecânicos em vez de leitura subjetiva de gráficos
Resumo
Resumo de IA
The Parabolic RSI Alert indicator integrates the Relative Strength Index (RSI) with a custom Parabolic SAR to identify high-probability trend reversal points. It provides clear visual signals and real-time alerts to assist traders in timely decision-making. Designed for use on 1-hour and higher timeframes, the indicator highlights strong reversal signals particularly when they occur in overbought or oversold zones, while also signaling less extreme reversals. Parabolic SAR points are displayed when the corresponding option is enabled. This tool aims to reduce lag commonly associated with traditional RSI analysis and offers mechanical, objective signals supported by both visual and audible alerts. It is suitable for traders who prefer systematic entry and exit cues and can be combined with price action or other indicators for confirmation.
Perfil do indicador
Avaliações de clientes
4.5
Avaliações: 2
5 | 50 % | |
4 | 50 % | |
3 | 0 % | |
2 | 0 % | |
1 | 0 % |
Avaliações de clientes
October 10, 2025
Smooth combo! 🎯 Parabolic RSI Alert mixes momentum & trend perfectly — clean entries, fewer fakeouts. Great hybrid for swing or intraday setups.
August 18, 2025
Conversa
Perguntas frequentes
Os produtos disponíveis através da cTrader Store, incluindo bots de negociação, indicadores e plugins, são fornecidos por programadores terceiros e são disponibilizados apenas para fins informativos e de acesso técnico. A cTrader Store não é um corretor e não fornece aconselhamento em matéria de investimento, recomendações pessoais ou qualquer garantia de desempenho no futuro.


Preço
Desde 14/07/2025
60
Vendas