
Descripción
El Índice de Fuerza de Dirección de Tendencia (TDFI) es un indicador poderoso basado en el momentum diseñado para ayudar a los traders a identificar movimientos fuertes de tendencia y posibles reversiones con precisión. Al analizar la relación entre dos medias móviles y su tasa de cambio, el TDFI filtra el ruido del mercado y resalta oportunidades de trading de alta probabilidad.
Características clave:
✅ Identificación clara de la tendencia – Distingue visualmente el momentum alcista (verde) y bajista (rojo) basado en umbrales personalizables.
✅ Suavizado adaptativo – Utiliza múltiples tipos de medias móviles (EMA, WMA, Hull, TEMA, etc.) para una respuesta óptima.
✅ Reducción de ruido – La normalización dinámica asegura que solo movimientos significativos del precio generen señales.
✅ Alertas personalizables – Recibe notificaciones en tiempo real cuando las tendencias se fortalecen o revierten.
✅ Funciona en todos los marcos temporales – Efectivo para scalping, day trading y swing trading.
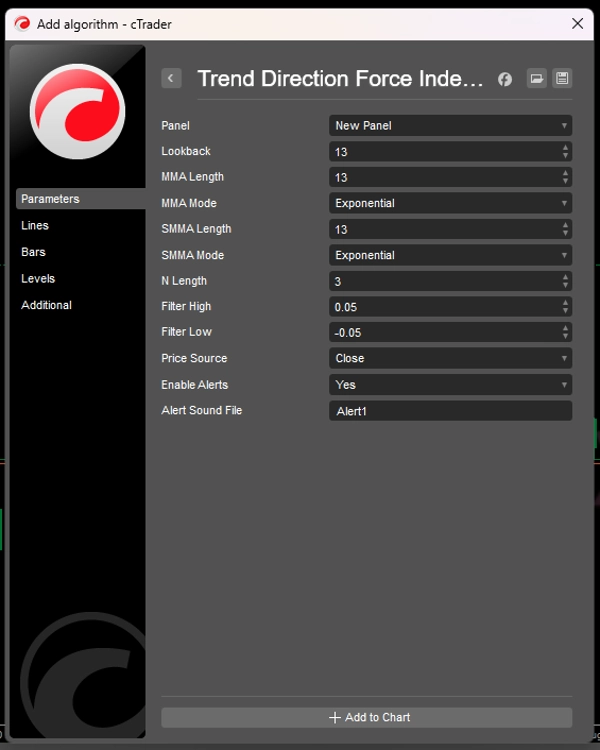
Cómo funciona el TDFI
El TDFI mide la fuerza de la tendencia analizando la divergencia y momentum entre dos medias móviles especialmente ajustadas:
- MMA (Media Móvil Principal) – Rastrea el momentum del precio a corto plazo
- SMMA (Media Móvil Suavizada) – Identifica la tendencia subyacente
Luego, el indicador calcula:
🔹 Fuerza de Divergencia – Qué tan separadas están las MMAs (fuerza de la tendencia)
🔹 Aceleración del Momentum – Qué tan rápido se mueve la tendencia
🔹 Salida Normalizada – Escala las señales para evitar valores extremos
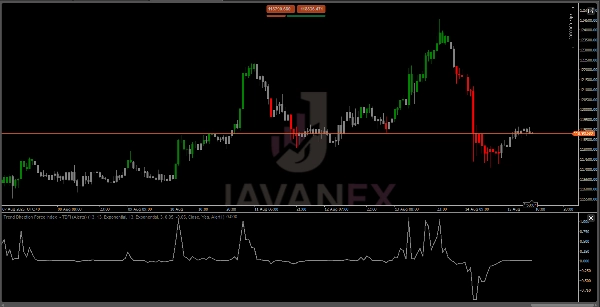
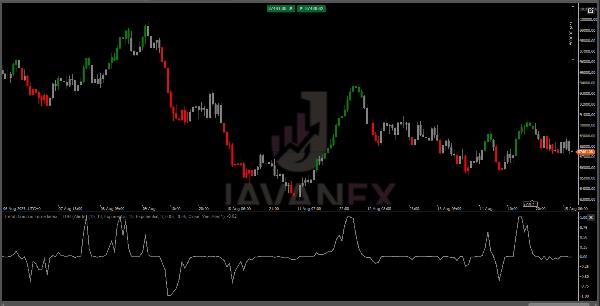
Cuando estas fuerzas se combinan:
- TDFI > Umbral Superior (Verde) = Momentum alcista fuerte
- TDFI < Umbral Inferior (Rojo) = Momentum bajista fuerte
- Entre Umbrales (Gris) = Neutral/consolidación
Resumen
Valoraciones de clientes
5 | 75 % | |
4 | 25 % | |
3 | 0 % | |
2 | 0 % | |
1 | 0 % |


