
Automatic Fibonatti
지표
3 구매
버전 1.2, Apr 2026
Windows, Mac
5.0
리뷰: 2
설명
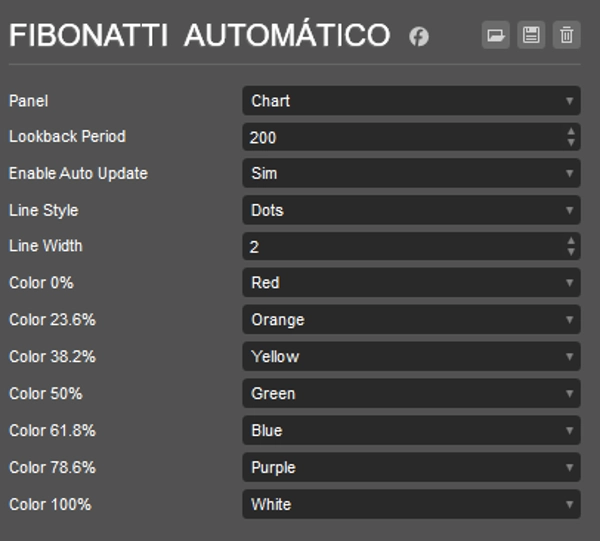
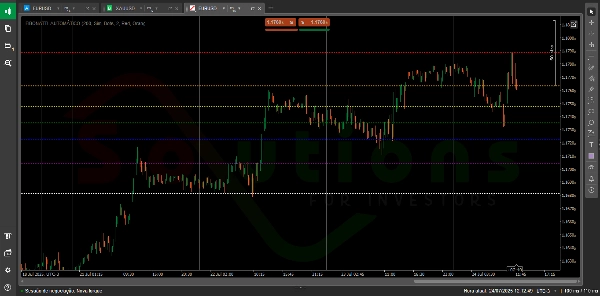
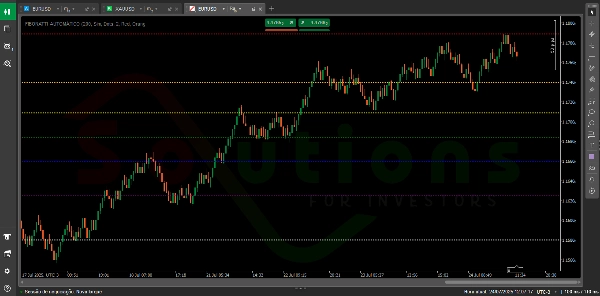
cTrader용 자동 피보나치
핵심 가격 수준을 자동으로 식별 — 전략에 완벽하게 맞춤 설정 가능.
자동 피보나치는 사용자가 정의한 기간 동안 최고가와 최저가를 기반으로 피보나치 되돌림 수준을 자동으로 그리는 스마트하고 유연한 지표입니다. 이 지표의 차별점은 완전한 맞춤 설정에 있습니다: 각 피보나치 수준의 색상, 선 스타일, 두께를 시각적 선호도와 거래 전략에 맞게 개인화할 수 있습니다. 또한 실시간 업데이트 기능을 제공하여 차트가 항상 최신 가격 움직임을 반영하며 수동 조정이 필요 없습니다.
요약
지표 프로필
고객 리뷰
5.0
리뷰: 2
5 | 100 % | |
4 | 0 % | |
3 | 0 % | |
2 | 0 % | |
1 | 0 % |
고객 리뷰
March 7, 2025
The product earns time when it gives the trader a reason to pause. It should not replace the chart.
February 28, 2025
there is less room for random clicking, but manual context is still required.
상담
자주 묻는 질문(FAQ)
BTCUSD
Forex
Signal
Indices
EURUSD
Commodities
GBPUSD
NZDUSD
Fibonacci
Prop
Scalping
Crypto
Stocks
XAUUSD
NAS100
USDJPY
트레이딩 봇, 지표, 플러그인 등 cTrader Store에서 제공되는 상품은 제3자 개발자에 의해 제공되며, 이는 단순히 정보 및 기술적 접근을 목적으로 제공된 것입니다. cTrader Store는 중개인이 아니며, 투자 조언, 개인별 추천 또는 향후 성과에 대한 어떠한 보장도 제공하지 않습니다.
이 작성자의 상품 더 보기


가격
가입일 05/02/2025
31
판매