
설명
변동성 돌파 지표 - 호크스 변동성 엔진
이 지표는 즉각적인 거래 행동이 아니라 상황 인식을 제공하기 위한 것입니다. 변동성 구성 요소는 시장 상황이 변하고 있음을 알 수 있도록 도와줍니다 - 낮은 변동성 기간은 종종 큰 움직임에 앞서며, 높은 변동성 기간은 결국 소진됩니다. EWMA 구성 요소는 발전하는 추세를 파악하게 해주고 가격이 추세에서 벗어날 때를 강조합니다.
이 두 가지 관점 - 변동성 체계와 추세 상황 - 을 자신의 거래 방법론과 판단과 결합하세요. 이 지표는 환경을 보여줄 뿐이며, 그 안에서 무엇을 할지는 당신이 결정합니다.
버전 2.0
향후 업데이트를 위해 열려 있음
-----------------------------------------------------------------------------------------------------------------------------------------------------------------------
개요
-----------------------------------------------------------------------------------------------------------------------------------------------------------------------
이 지표는 두 가지 별개의 구성 요소를 결합하여 거래자가 변동성 체계와 추세 상황을 동시에 식별할 수 있도록 돕습니다.
첫 번째 구성 요소는 호크스 프로세스를 사용하여 시장 변동성 변화를 감지합니다. 전통적인 변동성 지표와 달리 방향을 예측하지 않고, 단순히 시장이 조용한 압축 상태에서 활발한 변동성 상태로 전환되거나 그 반대임을 신호합니다. 변동성 상태 감지기로 생각하세요: 상황이 뜨거워지거나 식고 있음을 알려주지만 가격이 어느 방향으로 움직일지는 알려주지 않습니다.
두 번째 구성 요소는 가격 차트 위에 중첩되는 이중 EWMA(지수 가중 이동평균) 시스템을 추가합니다. 빠른 이동평균과 느린 이동평균의 교차를 사용해 추세 상황을 제공하며, 가격이 추세에서 벗어날 때 촛대 색상을 추가로 표시합니다.
-----------------------------------------------------------------------------------------------------------------------------------------------------------------------
작동 방식
-----------------------------------------------------------------------------------------------------------------------------------------------------------------------
변동성 감지: 이 지표는 파킨슨의 고가-저가 변동성 추정기를 사용합니다—표준 ATR보다 효율적인 방법으로 전체 바 범위를 사용합니다. 이 정규화된 변동성은 호크스 프로세스 계산에 입력되며, 동적 분위수 기반 임계값과 비교됩니다.
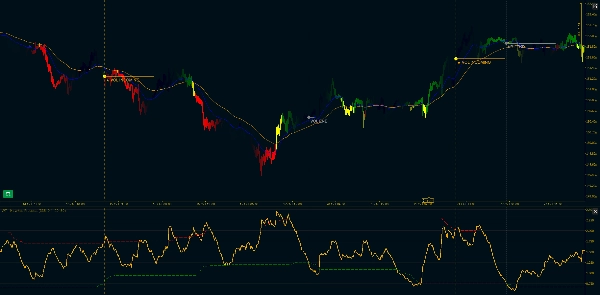
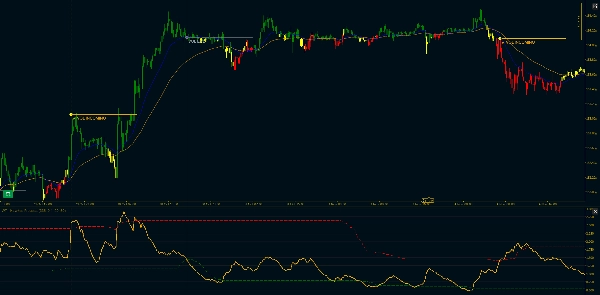
변동성이 압축 기간 후 상한 임계값을 돌파하면 "VOL INCOMING" 신호가 나타납니다. 변동성이 하한 임계값 아래로 떨어지면 "VOL END"가 표시됩니다. 이는 진입 신호가 아니라 변동성 체계 변화 신호입니다. 시장이 깨어나거나 잠들고 있는 상태입니다.
추세 상황: 두 개의 지수 가중 이동평균선(빠름과 느림)이 메인 차트에 표시됩니다. 빠른 MA는 파란색, 느린 MA는 주황색입니다. 빠른 MA가 느린 MA 위에 있으면 추세는 상승, 아래에 있으면 하락입니다.
발산 필터: 여기서 흥미로운 점이 있습니다. 때때로 가격이 추세에서 크게 벗어납니다. 상승 추세 동안 전체 캔들(시가, 고가, 저가, 종가)이 빠른 MA 아래에 있거나 하락 추세 동안 빠른 MA 위에 있으면 바가 노란색으로 변합니다. 이것은 엄격한 필터로, 심지어 심지도 빠른 MA에 닿으면 정상 추세 색상을 유지합니다.
노란색 바는 종종 되돌림이나 소진 지점에서 나타나지만, 다음에 무엇이 올지는 알려주지 않고 단지 가격이 일시적으로 추세선에서 분리되었음을 나타냅니다.
-----------------------------------------------------------------------------------------------------------------------------------------------------------------------
주요 기능
-----------------------------------------------------------------------------------------------------------------------------------------------------------------------
변동성 구성 요소:
- 파킨슨 고가-저가 변동성 정규화 (표준 ATR 방법보다 효율적)
- 조정 가능한 감쇠(Kappa 매개변수)를 가진 호크스 프로세스 계산
- 동적 분위수 기반 임계값 (사용자 정의 가능한 백분위수)
- 시각적 표시기: 변동성 돌파 시 "VOL INCOMING", 압축 시 "VOL END"
- 연속 필터링: 첫 번째 돌파만 표시, 모든 스파이크는 표시하지 않음
- 선택적 수평 추세선 및 수직 표시기
EWMA 추세 구성 요소:
- Pandas 호환 EWMA 계산 (adjust=True 공식)
- 메인 가격 차트에 빠른 MA와 느린 MA 선 표시
- 사용자 정의 가능한 기간 길이 (기본값: 20/50)
- 최소 기간 지원 (충분한 데이터가 있을 때까지 출력 억제)
- 갭 처리를 위한 NA 무시 옵션
- 3색 촛대 시스템: 녹색(상승 추세), 빨간색(하락 추세), 노란색(발산)
사용자 정의 옵션:
- 파킨슨 기간 (변동성 계산을 위한 조회 기간)
- 호크스 Kappa (감쇠율, 민감도에 영향)
- 분위수 조회 기간
- 낮은 및 높은 변동성 임계값 (백분위수)
- 연간화 토글 및 구간 길이
- 이동평균을 위한 빠른 및 느린 기간
- 강세, 약세 및 발산 색상
- 추세선 확장 길이
- 수직 표시기 표시/숨기기
----------------------------------------------------------------------------------------------------------------------------------------------------------------------------
기술적 참고: 호크스 프로세스 구성 요소는 실시간 사용에 최적화된 재귀적 지수 계산을 사용합니다. EWMA 구현은 Python 기반 백테스팅과의 일관성을 위해 Pandas 동작과 일치합니다. 두 구성 요소 모두 리페인팅을 방지하기 위해 닫힌 바에서만 계산합니다.
요약
고객 리뷰
5 | 100 % | |
4 | 0 % | |
3 | 0 % | |
2 | 0 % | |
1 | 0 % |


