설명
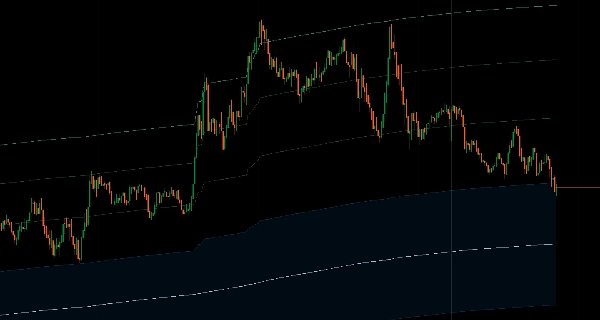
이동 평균 계산을 시장의 특정 순간에 고정하고 앞으로 확장됨에 따라 가격 동향을 추적하세요.
선택한 시작점(수동 날짜 및 시간 또는 1시간에서 10년까지의 회귀 기간)에 계산을 고정한 후 실제 가격 범위를 기반으로 하는 적응형 피보나치 밴드와 함께 자연스럽게 확장됩니다.
실제 가격 움직임에 적응하는 8개의 피보나치 레벨(11.4%에서 100%), 내장된 38.2%-62.8% 평균 회귀 구역, 두 가지 MA 유형(SMA/EMA), 다양한 표시 모드(전체 밴드, 극한 경계만, 회귀 구역만), 장기 기간 제한자는 중요한 스윙 포인트에서의 되돌림과 이벤트 후 가격 행동 분석을 목표로 하는 트레이더를 위한 이벤트 기반 모멘텀 추적을 제공합니다.
특징
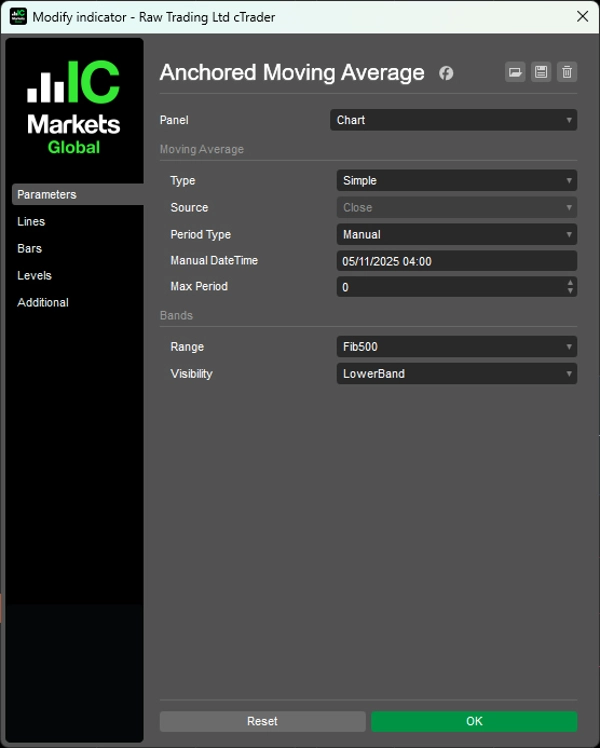
시간 고정 계산
- 고정 기간을 사용하는 일반 MA와 달리 선택한 시작점에서 자연스럽게 확장됩니다
- 유연한 고정: 수동 날짜 및 시간 설정 또는 사전 정의된 회귀 기간(1시간에서 10년) 사용 가능
- 중요한 시장 순간부터 모멘텀 추적
- 다른 시간대에서도 일관된 고정점 유지
적응형 피보나치 밴드
- 임의의 ATR 배수가 아닌 실제 가격 범위를 기반으로 자동 계산된 밴드
- 실제 가격 움직임에 적응하는 8개의 피보나치 레벨(11.4%에서 100%)
- 평균 회귀 구역: 높은 확률의 진입 영역을 위한 내장 38.2%-62.8% 회귀 구역
- 수학적으로 정의된 확률 구역
두 가지 MA 유형
- 단순 이동 평균
- 지수 이동 평균
- 최대 기간 제한자: 장기 기간에서 과도한 평활화 방지
다양한 표시 모드
- 전체 밴드: 모든 피보나치 레벨 표시
- 상/하단만: 극한 경계 표시
- 회귀 구역만: 평균 회귀 영역에 집중
- 깔끔하고 목적이 분명한 디자인, 불필요한 요소 없음
이벤트 기반 분석
- 현재 가격이 중요한 수준에서의 움직임과 어떻게 관련되는지 확인
- 이벤트 후 가격 행동 추적
- 명확한 기준점을 가진 구조 기반 진입
__________________________________________________________________________________________
더 많은 무료 지표
구조와 거래량부터 회귀, 변동성, 맞춤 시간대에 이르기까지 다양한 시장 분석 도구를 탐색하세요.
소스 코드는 GitHub 저장소에서 확인할 수 있습니다.
모두 무료로 사용할 수 있습니다. 하지만 커피 지원을 보내고 싶다면 여기로 보내실 수 있습니다.
지지/저항
거래량
이동 평균
유틸리티/맞춤형
회귀 기반
변동성
오실레이터
__________________________________________________________________________________________
면책 조항
거래에는 위험이 따릅니다. 이 지표는 기술적 분석 용도로만 사용되며 항상 적절한 위험 관리와 책임 있는 거래를 적용하세요.
피드백 및 개선 사항
제안, 기능 요청 또는 개선 아이디어가 있으시면 토론 탭에 댓글을 남겨주세요. 여러분의 피드백은 모든 사용자를 위한 지표 개선에 도움이 됩니다.
요약
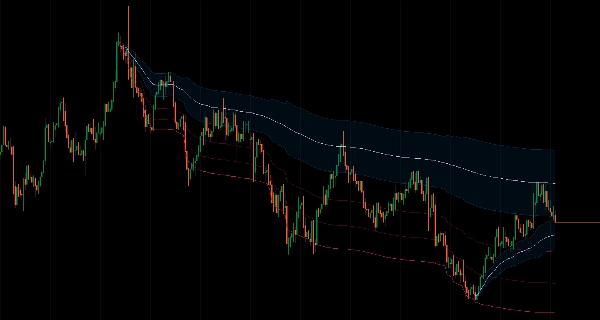
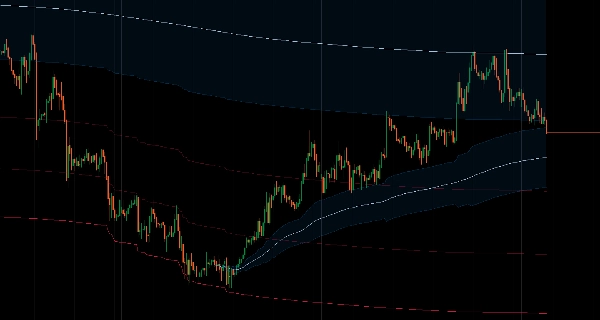
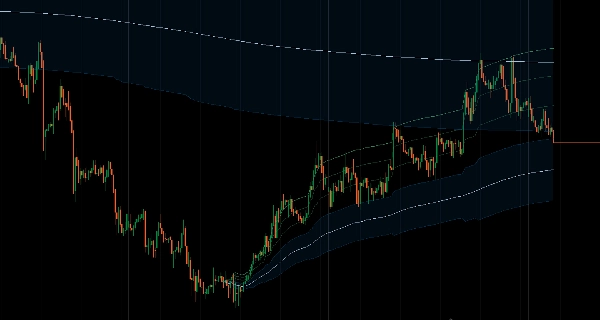
The indicator features adaptive Fibonacci bands calculated based on the actual price range, not arbitrary multiples. It includes eight Fibonacci levels from 11.4% to 100%, with a built-in mean reversion zone between 38.2% and 62.8%, providing mathematically defined probability zones for potential entry areas. Multiple display modes are available, including full bands, extreme boundaries only, or reversion zone only, designed for a clean and purposeful chart presentation.
This tool facilitates analysis of price behavior relative to significant swing points or events, supporting structured entries and post-event price tracking. It is intended for technical analysis and includes a disclaimer advising responsible trading with proper risk management.
고객 리뷰
5 | 100 % | |
4 | 0 % | |
3 | 0 % | |
2 | 0 % | |
1 | 0 % |


!["[Hamster-Coder] Bollinger Bands" 로고](https://cdn.ctrader.com/image/webp/21d8e5d6-fb11-4bac-b9ee-cd05c2b76804_30327)