
설명
중요 참고 사항 - 먼저 읽어주세요
외환 거래량은 실제 거래량이 아닙니다
외환의 거래량은 틱 거래량입니다 — 가격이 몇 번 변했는지를 계산합니다. 거래된 금액은 계산하지 않습니다.
틱 거래량이 보여주지 못하는 것
- 거래 크기. 100달러 거래와 1,000만 달러 거래는 모두 1틱으로 계산됩니다.
- 실제 자금 흐름. 큰 자금이 움직였는지 작은 자금이 움직였는지 알 수 없습니다.
- 진정한 유동성. 시장에 대기 중인 주문 수를 알 수 없습니다.
- 은행 활동. 은행은 실제 거래량 데이터를 봅니다. 여러분은 볼 수 없습니다.
이것이 의미하는 바
틱 거래량은 가격 변동 빈도만 보여주며, 그 뒤에 있는 자금은 보여주지 않습니다. 이로 인해 다음과 같은 문제가 발생합니다:
- 은행이나 기관을 추적할 수 없습니다. 그들은 여러분이 접근할 수 없는 실제 거래량 데이터를 사용합니다.
- "스마트 머니" 이론을 증명할 수 없습니다. 그런 아이디어는 틱 수가 아닌 실제 거래량이 필요합니다.
- 진정한 유동성을 판단할 수 없습니다. 틱 활동은 주문 깊이나 실제 시장 강도를 보여주지 않습니다.
- 실제 매수 또는 매도 세력을 측정할 수 없습니다. 많은 작은 거래가 하나의 큰 기관 거래와 똑같이 보입니다.
- 거래량 급증은 거짓일 수 있습니다. 급증은 실제 거래 관심이 아닌 알고리즘 노이즈일 수 있습니다.
이 지표를 올바르게 사용하는 방법
- 돈의 척도가 아닌 활동의 척도로 취급하세요. 높은 틱 거래량 = 시장이 활발함. 낮은 틱 거래량 = 시장이 조용함. 그 이상은 아닙니다.
- 다른 시간대 간 활동을 비교하세요. 런던 세션이 뉴욕보다 더 바쁜가? 오늘이 어제보다 더 활발한가? 추세 기간이 횡보 기간보다 더 바쁜가? 등을 확인하는 데 사용하세요.
- 가격 구조와 결합하세요. 지지/저항, 스윙 포인트, BOS/ChoCH와 함께 거래량을 사용하세요. 가격 맥락은 시끄러운 거래량 급증으로 인한 잘못된 신호를 방지합니다.
- 중요 가격 수준에서 활동을 관찰하세요. 가격이 주요 수준을 테스트하고 틱 거래량이 증가하면 더 많은 트레이더가 활동 중임을 의미합니다. 큰 플레이어가 개입했다는 의미는 아닙니다.
- 기관 활동을 보여준다고 가정하지 마세요. 틱 거래량은 누적, 대량 주문, 또는 "스마트 머니"를 보여줄 수 없습니다. 리듬과 템포를 측정하는 데만 사용하세요.
__________________________________________________________________________________________
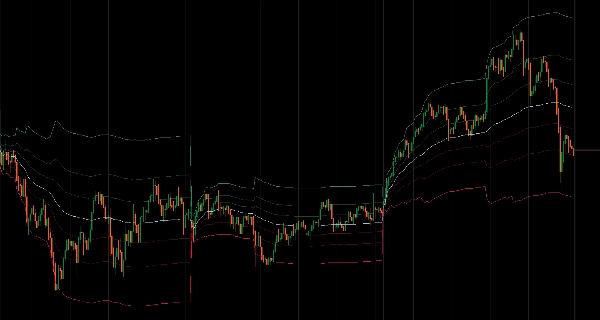
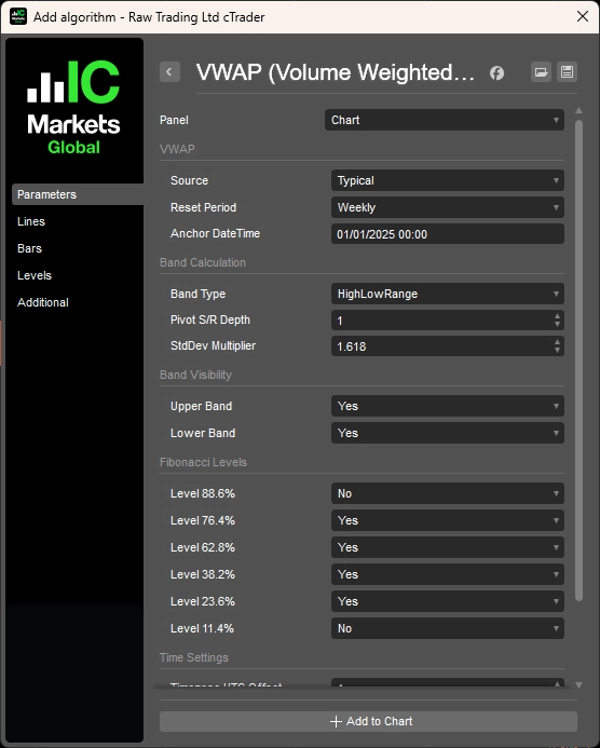
유연한 리셋 기간과 세 가지 밴드 계산 방법을 갖춘 거래량 가중 평균 가격(VWAP).
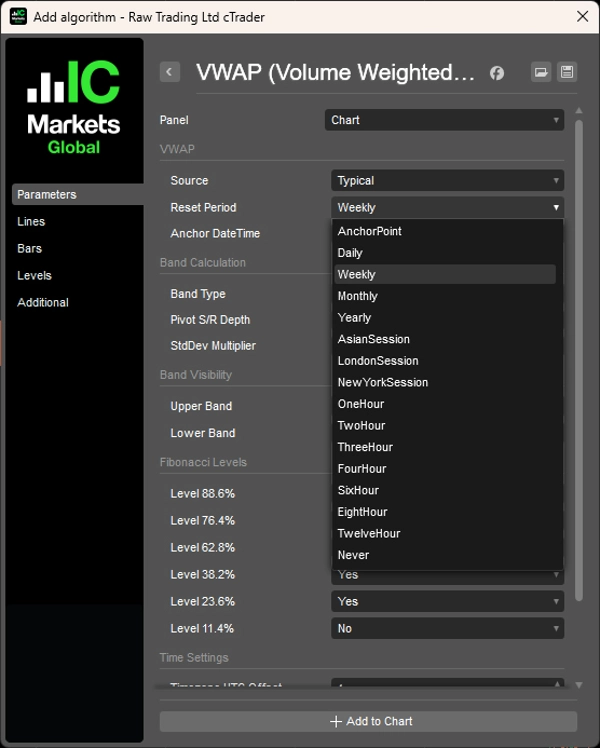
일간, 주간, 월간, 연간 또는 사용자 정의 시간별 간격과 같은 시간 기반 간격, 아시아, 런던, 뉴욕 세션 기반 리셋(시작 시간 설정 가능), 특정 이벤트에 VWAP를 고정하는 앵커 포인트 모드, 또는 모든 사용 가능한 데이터에서 롤링 계산을 포함한 유연한 리셋 기간으로 거래량 가중 평균 가격을 계산합니다.
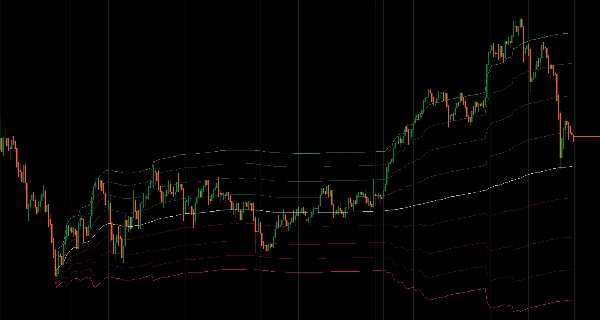
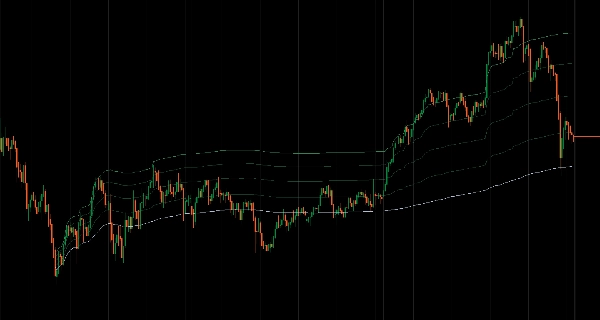
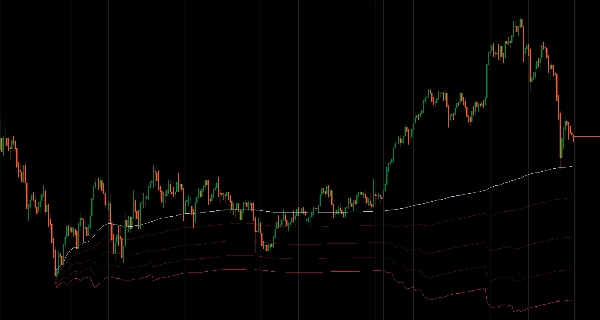
세 가지 밴드 계산 방법을 제공합니다: 이전 기간 가격 범위를 기반으로 한 고가/저가 범위, 고전적인 피벗 계산을 사용하는 피보나치 피벗, 변동성에 따라 확장 및 축소되는 표준 편차 밴드.
8개의 피보나치 레벨(100%, 88.6%, 76.4%, 62.8%, 50%, 38.2%, 23.6%, 11.4%, 0%)을 개별 가시성 토글과 빠른 상/하 밴드 그룹 컨트롤로 사용자 정의할 수 있습니다. 세션 관리는 UTC 오프셋 조정과 시간대 인식 시간별 리셋 처리를 포함한 정확한 시작 시간 구성을 포함합니다.
특징
- 유연한 리셋 기간
-
- 시간 기반: 일간, 주간, 월간, 연간 또는 사용자 정의 시간별 간격(1H, 2H, 3H, 4H, 6H, 8H, 12H)
- 세션 기반: 시작 시간과 시간대 오프셋 설정이 가능한 아시아, 런던, 뉴욕 세션
- 앵커 포인트: 이벤트 기반 분석을 위해 VWAP를 특정 날짜 및 시간에 고정
- 롤링: 리셋 없이 모든 사용 가능한 데이터에서 계산
- 세 가지 밴드 계산 방법
-
- 고가/저가 범위: 이전 기간 가격 범위를 기반으로 한 밴드
- 피보나치 피벗: 이전 기간의 고가/저가/종가를 이용한 고전적 피벗 포인트 계산
- 표준 편차: 변동성에 따라 확장 및 축소되는 전통적인 통계 밴드
- 완벽한 피보나치 레벨 제어
-
- 8개의 사용자 정의 가능한 레벨: 100%, 88.6%, 76.4%, 62.8%, 50%(VWAP), 38.2%, 23.6%, 11.4%, 0%
- 개별 레벨 가시성 토글
- 빠른 조정을 위한 상/하 밴드 그룹 컨트롤
- 세션 관리
-
- UTC 오프셋 조정(-12에서 +14시간)과 함께 정확한 세션 시작 시간 구성
- 현재 리셋 일정을 보여주는 시각적 세션 정보 표시
- 시간대 인식 시간별 리셋 처리
- 성능 최적화
-
- 지연 계산 — 밴드는 보일 때만 계산
- 지능형 캐싱 및 배치 처리
- 모든 레벨 활성화 시에도 최소한의 CPU 영향
__________________________________________________________________________________________
더 많은 무료 지표
구조와 거래량부터 회귀, 변동성, 사용자 정의 시간 프레임에 이르기까지 다양한 시장 분석 도구를 탐색하세요.
소스 코드는 GitHub 저장소에서 확인할 수 있습니다.
모두 무료로 사용할 수 있습니다. 하지만 커피 지원을 보내고 싶다면 여기로 보내실 수 있습니다.
지지/저항
거래량
이동 평균
유틸리티/커스텀
회귀 기반
변동성
오실레이터
__________________________________________________________________________________________
면책 조항
거래에는 위험이 따릅니다. 이 지표는 기술적 분석 용도로만 사용되며 항상 적절한 위험 관리를 적용하고 책임감 있게 거래하세요.
피드백 및 개선 사항
제안, 기능 요청 또는 개선 아이디어가 있으시면 토론 탭에 댓글을 남겨주세요. 여러분의 피드백은 모두를 위한 지표 개선에 도움이 됩니다.
요약
The indicator offers three band calculation methods: High/Low Range bands based on the previous period's price range, Fibonacci Pivot bands using classical pivot calculations, and Standard Deviation bands that adjust with market volatility. Users can customize eight Fibonacci levels (ranging from 0% to 100%) with individual visibility toggles and group controls for upper and lower bands.
Session management features include precise start time configuration with UTC offset adjustments and timezone-aware hourly resets, along with visual session information display. Performance optimizations include lazy calculation of bands only when visible, intelligent caching, and batch processing to minimize CPU usage.
Note: For forex markets, volume data represents tick volume (price change counts) rather than actual traded volume, so this indicator should be used as a measure of market activity rather than real money flow. It is intended for technical analysis with proper risk management.
고객 리뷰
5 | 100 % | |
4 | 0 % | |
3 | 0 % | |
2 | 0 % | |
1 | 0 % |


