
설명
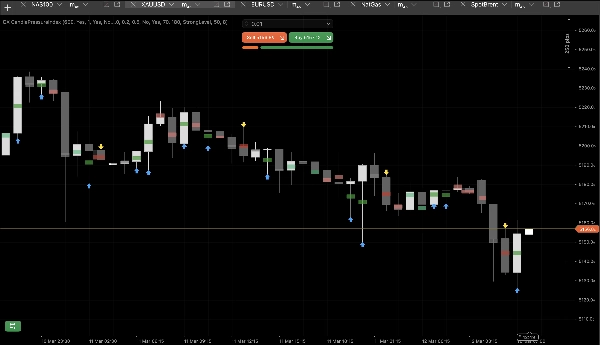
QX Candle Pressure Index 는 cTrader용 캔들 압력 오버레이로, 트레이더가 각 캔들이 자신의 범위 내에서 얼마나 강하게 마감하는지 읽는 데 도움을 줍니다.
별도의 오실레이터 창을 사용하는 대신, CPI는 메인 차트에 콤팩트한 중간점 마커를 통해 압력을 직접 표시합니다. 이를 통해 마감 강도, 강세 또는 약세 편향, 단기 모멘텀을 시각적 잡음 없이 더 쉽게 읽을 수 있습니다.
주요 용도
CPI는 트레이더가 다음을 할 수 있도록 설계되었습니다:
- 캔들 마감 품질 평가
- 방향성 압력 확인
- 돌파 강도 평가
- 풀백을 더 명확하게 읽기
- 모멘텀 변화를 더 일찍 포착
작동 원리
각 캔들은 자신의 범위 내에서 마감 위치에 따라 분류됩니다:
- 고점 근처 = 강세 압력
- 저점 근처 = 약세 압력
- 중간 근처 = 중립 압력
이 정보는 다음을 사용하여 표시됩니다:
- 중간점 압력 마커
- 5개의 압력 구역
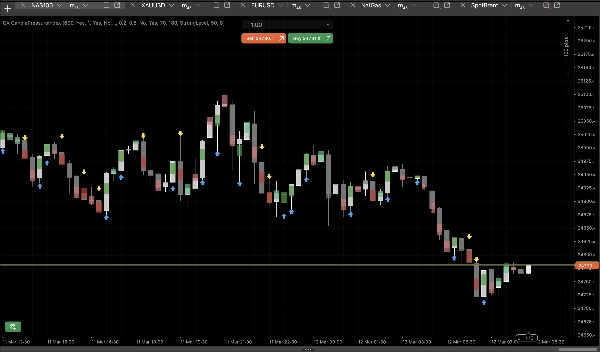
- 강한 압력을 위한 선택적 화살표
- 선택적 바디 오버레이
압력 구역
CPI는 캔들을 5가지 시각적 상태로 구분합니다:
- 강한 매수
- 약한 매수
- 중립
- 약한 매도
- 강한 매도
이것은 트레이더가 움직임이 강한지, 약한지, 균형 잡혔는지 식별하는 데 도움을 줍니다.
주요 기능
중간점 압력 마커
캔들 중간점에 고정된 콤팩트한 시각적 마커.
5개의 압력 구역
강한, 약한, 중립 마감을 명확히 구분.
형성 중인 바 건너뛰기
바가 마감될 때까지 실시간 캔들을 무시하여 더 안정적인 판독값 제공.
중립 마커 숨기기
방향성 캔들만 표시하여 차트를 더 깔끔하게 유지.
화살표 모드
강한 강세 또는 약세 캔들을 시각적으로 강조.
바디 오버레이
차트 읽기를 쉽게 하기 위해 미묘한 추가 레이어를 추가.
주요 매개변수 및 사용 방법
과거 바 표시 수
과거 캔들 몇 개를 표시할지 제어.
형성 중인 바 건너뛰기
닫힌 바 판독 및 더 안정적인 신호를 위해 켜기.
약한 임계값
캔들이 중립 상태를 벗어나는 시점을 정의.
강한 임계값
압력이 강해지는 시점을 정의.
중립 마커 숨기기
더 깔끔한 방향성 뷰를 위해 사용.
화살표 모드
화살표 없음, 모든 강한 캔들에 화살표, 또는 강한 전환에만 화살표 중 선택.
마커 크기 / 너비 / 불투명도
차트 스타일에 맞게 시각적 외관 조정.
최적 사용처
- 추세 지속 확인
- 돌파 품질 평가
- 풀백 분석
- 단기 모멘텀 판독
- 더 깔끔한 가격 행동 해석
요약
QX Candle Pressure Index 는 또 다른 지표 창을 추가하지 않고 차트에서 직접 캔들 압력을 읽고자 하는 트레이더를 위한 깔끔한 시각 도구입니다.
요약
고객 리뷰
5 | 50 % | |
4 | 50 % | |
3 | 0 % | |
2 | 0 % | |
1 | 0 % |


