
Revolusioner Analisis Grafik Anda
Melangkah ke masa depan analisis teknikal dengan Delta-RSI Candle Pro – indikator inovatif yang mengubah candlestick biasa menjadi visualisasi momentum yang kuat. Mengapa memenuhi layar Anda dengan banyak indikator ketika Anda bisa memiliki semua yang Anda butuhkan langsung pada lilin itu sendiri?
Solusi Trading Visual Serba Ada
-
- Pengakuan Sinyal Instan: Kekuatan dan arah momentum ditampilkan secara intuitif melalui warna
- Maksimalkan Ruang Layar: Hilangkan panel osilator terpisah selamanya
- Presisi Matematis: Regresi polinomial lanjutan menghitung momentum RSI yang sebenarnya
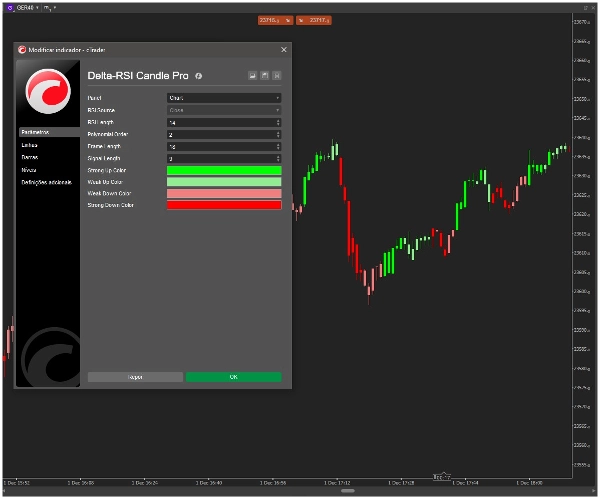
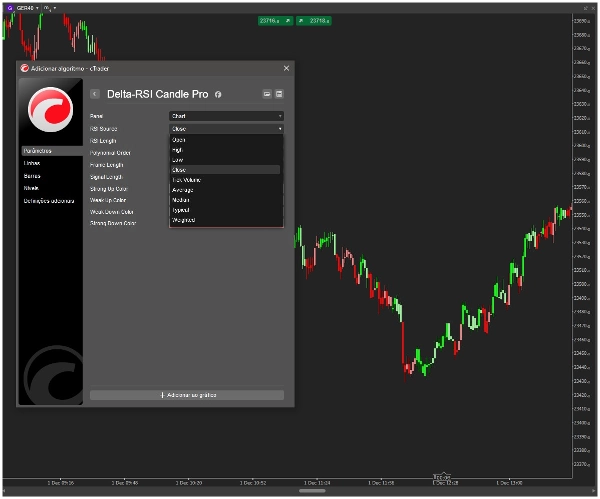
- Kustomisasi Lengkap: Gunakan pemilih warna asli cTrader untuk menyesuaikan gaya trading Anda
- Handal & Akurat: Perhitungan tanpa repaint berdasarkan data harga yang terkonfirmasi
Cara Kerja Delta-RSI Candle Pro
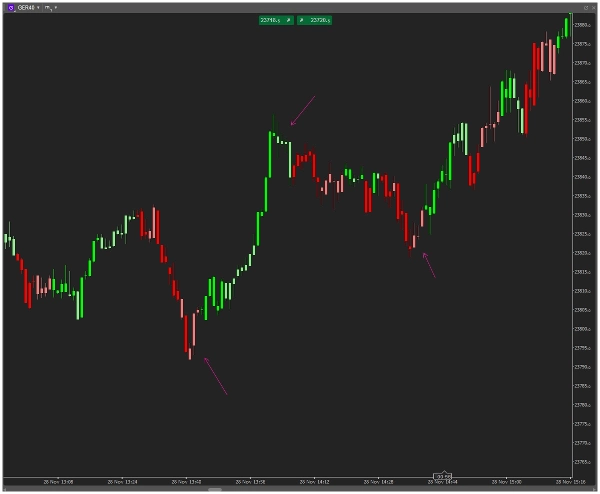
Algoritma kepemilikan kami menghitung turunan instan dari RSI menggunakan fitting kurva polinomial, kemudian memberikan warna cerdas pada setiap lilin:
-
- Bullish Kuat: Hijau intens – Momentum positif yang mempercepat
- Bullish Ringan: Hijau muda – Momentum positif namun perlu hati-hati
- Bearish Ringan: Merah muda – Momentum negatif namun potensi pembalikan
- Bearish Kuat: Merah tua – Momentum negatif yang mempercepat
Fitur Utama yang Membuat Kami Berbeda
-
- 🎯 Integrasi Langsung pada Lilin: Warna muncul langsung pada lilin trading Anda
- 🎨 Pemilihan Warna Visual: Pemilih warna cTrader yang intuitif – tanpa perlu nama kode
- ⚙️ Sepenuhnya Dapat Disesuaikan: Sesuaikan panjang RSI, orde polinomial, dan periode lookback
- 🚀 Performa Optimal: Mesin perhitungan ringan untuk operasi yang lancar
- 📊 Algoritma Kelas Profesional: Analisis turunan matematis untuk sinyal superior
Siapa yang Paling Diuntungkan?
-
- Trader Harian yang membutuhkan petunjuk momentum visual instan
- Trader Swing mengenali perubahan tren lebih awal
- Trader Minimalis yang tidak suka kekacauan grafik
- Trader Algoritmik mencari konfirmasi visual
- Semua Trader Serius yang menginginkan keunggulan dalam analisis pasar
Mulai dalam Hitungan Detik
-
- Tambahkan Delta-RSI Candle Pro ke grafik Anda
- Pilih warna favorit Anda menggunakan pemilih visual
- Sesuaikan parameter agar sesuai dengan kerangka waktu trading Anda
- Segera lihat pola momentum muncul pada lilin Anda
Keunggulan Teknis
-
- Jenis indikator overlay (tanpa panel terpisah)
- Algoritma tanpa repaint
- Perhitungan turunan polinomial dari RSI
- Kompatibel dengan semua simbol dan kerangka waktu
- Pembaruan dan peningkatan rutin
Sementara indikator lain menambah kompleksitas, Delta-RSI Candle Pro menyederhanakan dan meningkatkan. Kami telah mengambil analisis momentum matematis lanjutan dan membuatnya intuitif secara visual. Tidak perlu lagi membagi perhatian antara harga dan indikator – sekarang mereka bekerja bersama sebagai satu sistem yang kohesif.
Siap melihat grafik Anda dengan cara revolusioner baru?...
5 | 100 % | |
4 | 0 % | |
3 | 0 % | |
2 | 0 % | |
1 | 0 % |


