

Deskripsi
Visualisasi Dukungan & Perlawanan Institusional
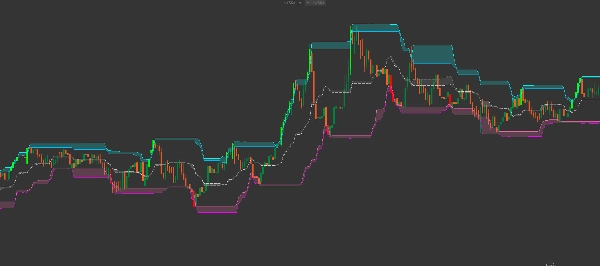
The Smart Donchian Cloud Reversal adalah saluran volatilitas generasi berikutnya yang dirancang untuk mengidentifikasi zona pembalikan dengan probabilitas tinggi. Berbeda dengan Saluran Donchian standar yang hanya melacak tertinggi tertinggi dan terendah terendah, indikator ini menganalisis hubungan antara sumbu lilin dan badan lilin untuk memplot "Awan Tekanan."
Awan-awan ini berfungsi sebagai zona Dinamis Penawaran dan Permintaan, menunjukkan dengan tepat di mana pasar kemungkinan akan berhenti atau berbalik.
Arsitektur Multi-Awan Lanjutan
Indikator ini menampilkan sistem awan 3 lapis yang canggih:
-
- Awan Perlawanan (Sian/Biru): Terletak di atas, ini memvisualisasikan celah antara sumbu tertinggi dan badan lilin tertinggi. Ini adalah "Zona Penjualan."
- Awan Keseimbangan (Abu-abu/Perak): Pita tengah yang melacak keseimbangan pasar. Ini mewakili titik tengah nilai wajar antara sumbu dan badan.
- Awan Dukungan (Merah Muda/Magenta): Terletak di bawah, ini memvisualisasikan celah antara sumbu terendah dan badan lilin terendah. Ini adalah "Zona Pembelian."
Fitur Perdagangan Utama
-
- Filter Volatilitas ATR: Termasuk pengali ATR (Average True Range) bawaan untuk sedikit menggeser pita luar, menyaring kebisingan pasar dan "perburuan stop."
- Pewarnaan Lilin Pintar: Indikator secara otomatis menyoroti momentum breakout:
- Lilin LIME: Harga telah ditutup di atas Awan Perlawanan Atas (Breakout Bullish).
- Lilin MERAH: Harga telah ditutup di bawah Awan Dukungan Bawah (Breakout Bearish).
- Logika Sumbu vs. Badan: Dengan melihat ketebalan "awan", Anda dapat mengukur volatilitas. Awan tebal berarti sumbu panjang (penolakan/ketidakpastian tinggi), sementara awan tipis berarti aksi harga yang kuat dan tegas.
Cara Berdagang dengan Smart Donchian Clouds
1. Reversi Rata-Rata (Scalping) » Cari harga yang masuk ke Awan Perlawanan tanpa menutup di atasnya. Ini sering menunjukkan "fakeout," menandakan entri short dengan probabilitas tinggi kembali ke Garis Tengah.
2. Breakout Tren » Ketika sebuah lilin berubah menjadi Lime (menutup di atas filter sumbu atas), itu menandakan bahwa para bulls telah melewati zona perlawanan. Ini adalah sinyal kuat untuk strategi mengikuti tren.
3. Pantulan Dukungan »Perhatikan Awan Dukungan (Merah Muda). Ketika harga menyentuh zona ini selama penarikan dalam tren naik, ini mewakili area "Pembelian Bernilai" di mana pembeli institusional sering masuk.
Parameter Teknis
-
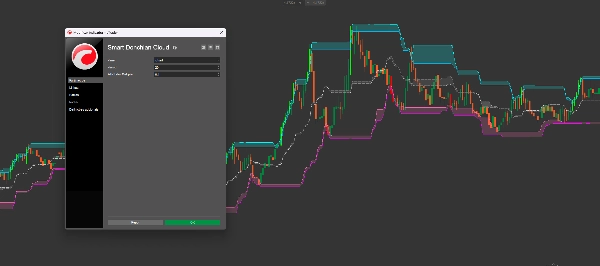
- Periode: Periode lookback untuk menghitung tertinggi dan terendah (Default: 20).
- Pengali Filter ATR: Menyesuaikan "padding" di sekitar ekstrem untuk menghindari terjebak dalam lonjakan kecil.
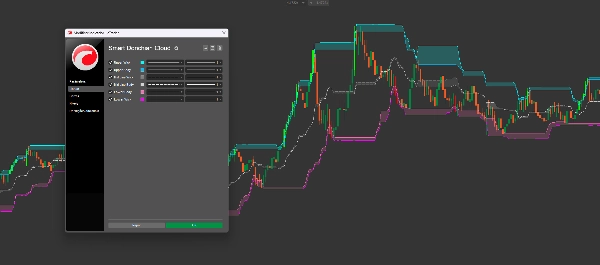
- Warna yang Sepenuhnya Dapat Disesuaikan: Sesuaikan awan Atas, Tengah, dan Bawah agar sesuai dengan template grafik pribadi Anda.
Mengapa Alat Ini Penting
Kebanyakan trader gagal karena mereka memperlakukan Dukungan dan Perlawanan sebagai garis tunggal. Sebenarnya, mereka adalah Zona. The Smart Donchian Cloud Reversal memetakan zona-zona ini secara matematis, memberi Anda gambaran struktur pasar yang lebih jelas daripada indikator saluran tradisional mana pun.
Ringkasan
Key features include an ATR-based volatility filter to reduce noise, and smart candle coloring that highlights breakout momentum—lime candles signal bullish breakouts above resistance, while red candles indicate bearish breakouts below support. The thickness of the clouds reflects volatility, with thicker clouds showing higher rejection or indecision.
Traders can use the indicator for mean reversion by spotting price entering but not closing above resistance, trend breakouts confirmed by lime candles, and support bounces where price touches the support cloud during pullbacks. The indicator’s parameters, such as lookback period and ATR multiplier, are customizable, along with cloud colors to fit user preferences.
Ulasan pelanggan
5 | 67 % | |
4 | 33 % | |
3 | 0 % | |
2 | 0 % | |
1 | 0 % |













![Logo "[Hamster-Coder] Bollinger Bands"](https://cdn.ctrader.com/image/webp/21d8e5d6-fb11-4bac-b9ee-cd05c2b76804_30327)











