
Session Open Lines and Bar Counter
Indikator
2 pembelian
Versi 1.1, Apr 2026
Windows, Mac
5.0
Ulasan: 3
Deskripsi
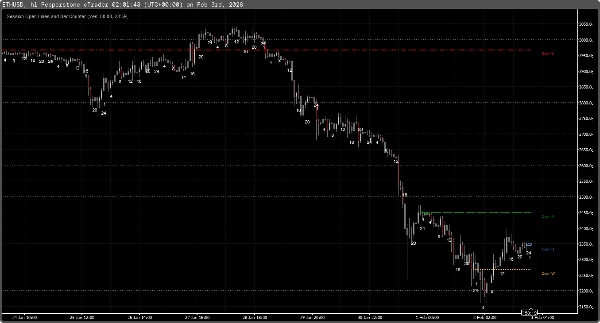
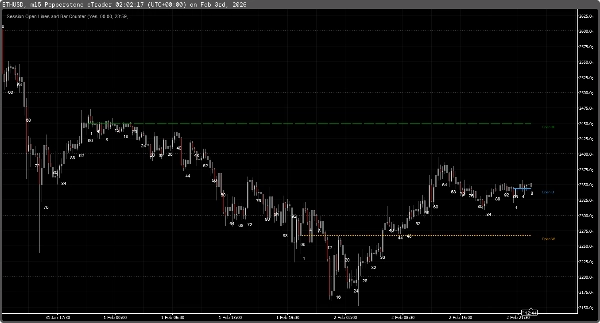
Garis Buka Sesi dan Penghitung Bar
Indikator Visual Utama untuk Aksi Harga (Al Brooks) & ICT/SMC.
TradersStop menggambar garis manual setiap hari. Session Open + Penanda High/Low melakukan semua pekerjaan berat untuk Anda dengan 1 klik.
Apa yang Anda Dapatkan:
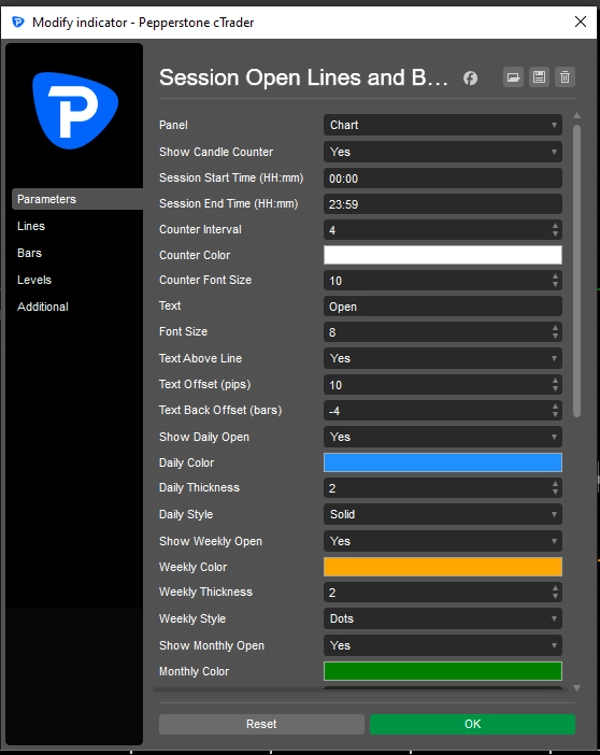
1. Pembukaan Sesi Otomatis
- Harian, Mingguan, Bulanan, Tahunan Open diplot pada grafik Anda dengan warna dan gaya kustom
- Label "Open D/W/M/Y" ditempatkan tepat di mana Anda inginkan.
- Sangat cocok untuk konsep Likuiditas, PD Arrays, dan pengaturan Judas Swing
2. High & Low dari Setiap Periode
- High & Low Harian, Mingguan, Bulanan, Tahunan digambar secara otomatis
- Tombol on/off individual untuk setiap kerangka waktu
- Label H/D L/D H/W L/W yang bersih untuk menjaga grafik Anda tetap rapi
- Esensial untuk menandai zona Premium/Discount dan level likuiditas
3. Penghitung Lilin Sesi
- Tahu persis lilin mana yang sedang Anda gunakan selama sesi NY, London, atau Asia
- Atur waktu mulai/akhir sesi kustom Anda
- Menampilkan angka setiap X lilin untuk menghindari kekacauan grafik
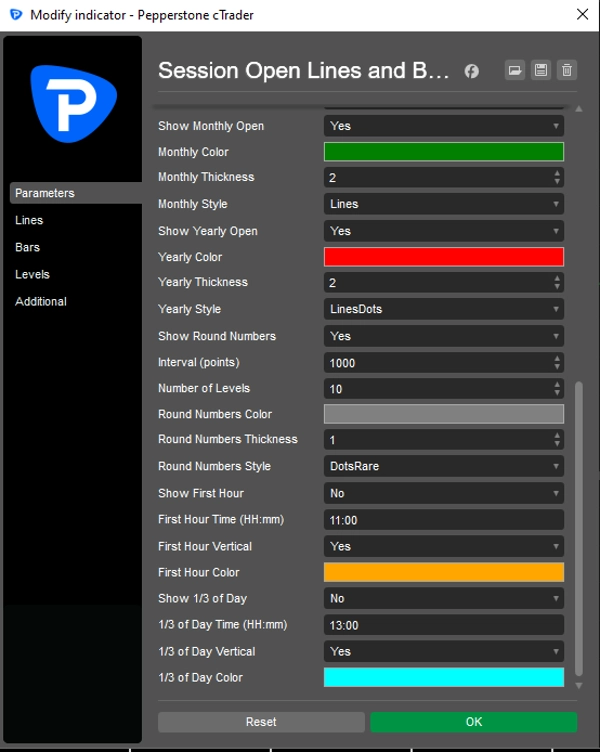
4. Level Psikologis & Waktu Kunci
- Angka Bulat dipplot otomatis: 1.1000, 1.1050, 1.1100...
- Garis Waktu untuk menandai jam 11 pagi, Killzones, atau waktu kritis lainnya
Mengapa Trader Profesional Menggunakannya:
Masalah Solusi Indikator
- Membuang waktu 10 menit setiap hari menggambar Open D dan H/L > Memplot otomatis semuanya saat Anda membuka grafik
- Grafik penuh dengan 15 indikator > 1 alat menggantikan 4 indikator terpisah
- Lupa menandai Open Mingguan > Menandai D/W/M/Y tanpa Anda pikirkan
- Tidak tahu apakah Anda berada di lilin sesi ke-3 atau ke-7 > Penghitung menunjukkan Anda secara instan
100% Dapat Disesuaikan
- Diatur berdasarkan grup: Harian, Mingguan, Bulanan, Tahunan
- Sesuaikan warna, ketebalan, gaya garis, dan font untuk setiap elemen
- Saklar on/off untuk setiap fitur. Gunakan hanya yang Anda butuhkan
Jaminan: Kode yang bersih dan ringan. Tidak akan membuat cTrader Anda lag bahkan pada grafik 1 menit.
Ringkasan
Ringkasan AI
Session Open Lines and Bar Counter is a customizable trading indicator designed to automatically plot key price levels and session information on charts. It auto-draws the Open, High, and Low prices for daily, weekly, monthly, and yearly periods, with options to customize colors, line styles, and label positions. The indicator includes a session candle counter that tracks the number of candles elapsed during major trading sessions such as New York, London, or Asian, with user-defined session start and end times. It also automatically plots psychological round numbers and key time markers to highlight critical price levels and trading times. Features can be toggled individually to reduce chart clutter, consolidating multiple indicators into one tool. This indicator supports various markets including Forex, Crypto, Indices, and Stocks, and is designed to be lightweight to avoid performance issues even on low timeframes. It is useful for traders applying price action, liquidity concepts, and market structure analysis.
Profil indikator
Ulasan pelanggan
5.0
Ulasan: 3
5 | 100 % | |
4 | 0 % | |
3 | 0 % | |
2 | 0 % | |
1 | 0 % |
Ulasan pelanggan
February 17, 2026
pretty decent as a backup check, especially in mixed charts. It should not replace the chart.
February 13, 2026
February 10, 2026
Most of the value comes from it helps separate patience from hesitation. It needs a boring test before bigger size.
Diskusi
Pertanyaan umum
BTCUSD
Forex
Indices
Crypto
Stocks
XAUUSD
NAS100
Produk-produk yang tersedia melalui cTrader Store, termasuk bot trading, indikator, dan plugin, disediakan oleh pengembang pihak ketiga serta hanya ditujukan untuk akses teknis dan informasi. cTrader Store bukan broker dan tidak menyediakan saran investasi, rekomendasi pribadi, atau jaminan apa pun tentang kinerja di masa mendatang.
Produk lain dari penulis ini


Harga
593.86K
Volume trading
25.15K
Pip dimenangkan
4
Penjualan
265
Instal gratis