
Mô tả
Market Cipher A là một chỉ báo kỹ thuật tiên tiến được thiết kế để phân tích, nhận dạng và dự đoán các xu hướng vĩ mô trên thị trường tiền điện tử một cách dễ dàng.
Cấu trúc và Thành phần
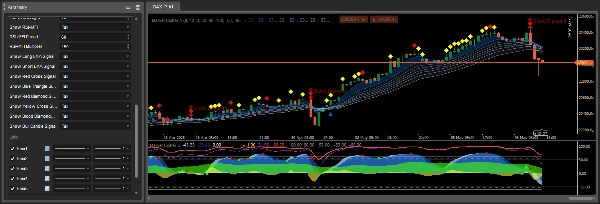
Market Cipher A bao gồm một dải 8 đường trung bình động hàm mũ (EMA) thay đổi màu sắc tùy theo xu hướng thị trường. Dải EMA chuyển sang màu xanh dương hoặc trắng trong thị trường tăng giá và màu xám trong thị trường giảm giá.
Theo mặc định, các đường trung bình động với giá trị EMA từ 5 đến 34 được sử dụng. Các điểm giao cắt của những đường này có thể là chỉ báo trễ rất mạnh, vì vậy Market Cipher A đã được lập trình để tự động hiển thị các biểu tượng tương ứng với các tín hiệu khác nhau, loại bỏ nhu cầu giải thích thủ công từng điểm giao cắt tăng hay giảm.
Biểu tượng và Tín hiệu Giao dịch
Market Cipher A hiển thị các biểu tượng đặc trưng trực tiếp trên biểu đồ nến cho biết các cơ hội giao dịch tiềm năng:
Tam giác xanh dương - tín hiệu đảo chiều xu hướng, cho thấy động lượng giảm và sự đảo chiều sắp tới. Đây là cảnh báo sớm rằng động lượng của xu hướng đang giảm.
Vòng tròn xanh lá - chỉ báo tăng giá, đáng tin cậy nhất trên khung thời gian 6 giờ trở lên. Thường xuất hiện sau tam giác xanh dương và nên được giải thích trong phạm vi 1-3 cây nến.
Kim cương vàng - chỉ ra sự tiếp tục của xu hướng tăng. Nên được sử dụng cùng với dải EMA để xác nhận tốt hơn hướng xu hướng.
Kim cương đỏ - báo hiệu sự suy yếu của xu hướng và khả năng tiếp tục giảm. Chỉ ra động lượng giảm tăng lên.
Chữ X đỏ - chỉ báo giảm giá, hiệu quả nhất trên khung thời gian 1 giờ trở lên. Nên được sử dụng cùng với dải EMA và kim cương đỏ.
Chữ X vàng - chỉ ra sự thao túng thị trường, đặc biệt là việc che phủ vị thế mua lớn được mua nhanh và bán bởi các vị thế bán.
Kim cương đỏ lớn (Kim cương máu) - tín hiệu giảm giá mạnh nhất, cho thấy khả năng giảm giá cao, đặc biệt khi xuất hiện cùng với chữ X đỏ hoặc kim cương đỏ nhỏ hơn.
Nguyên tắc Sử dụng
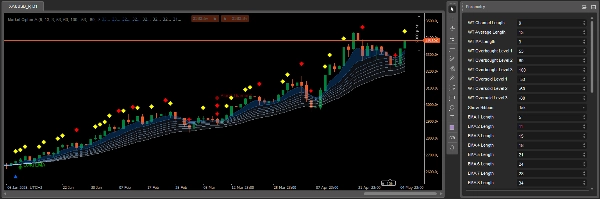
Market Cipher A cung cấp hỗ trợ hoặc kháng cự toán học mạnh mẽ một cách trực quan, giúp dễ dàng hiểu môi trường giao dịch. Nó hoạt động tốt nhất với nến Heiken Ashi.
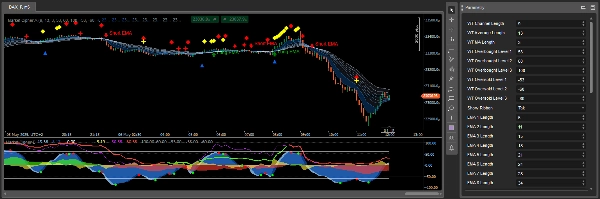
Dải EMA không chỉ chỉ ra xu hướng mà còn đóng vai trò là các mức hỗ trợ và kháng cự động. Khi dải màu xanh dương/trắng và nến nằm trên dải, bạn có thể tìm cơ hội vào vị thế mua. Khi dải màu xám và nến nằm dưới dải, bạn có thể cân nhắc vị thế bán.
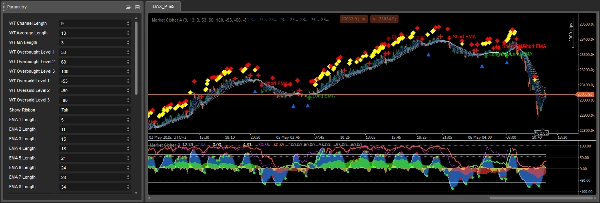
Kết quả tốt nhất đạt được khi các tín hiệu từ Market Cipher A được kết hợp với các chỉ báo khác trong gói Market Cipher, đặc biệt là Market Cipher B, cung cấp thêm tín hiệu động lượng và điểm vào lệnh.
Giải thích Chi tiết Tín hiệu trong Bối cảnh Xu hướng
Một khía cạnh quan trọng của Market Cipher A là giải thích tín hiệu theo ngữ cảnh tùy thuộc vào xu hướng chi phối. Khi dải chuyển màu từ xám sang xanh dương, chỉ báo tạo ra vòng tròn xanh lá như một tín hiệu cho sự bắt đầu của xu hướng tăng. Thông thường, sau vòng tròn xanh lá, nếu 1-3 cây nến tiếp theo hiển thị kim cương vàng, khả năng bứt phá là cao. Tuy nhiên, nếu xuất hiện kim cương đỏ, khả năng bứt phá thấp hơn.
Trong thị trường tăng giá, kim cương vàng là thuận lợi, cho thấy sự tiếp tục tăng phù hợp với xu hướng, trong khi kim cương đỏ đại diện cho một động thái ngược xu hướng. Trong thị trường giảm giá, tình huống ngược lại - kim cương đỏ thuận lợi như sự tiếp tục của sự giảm, và kim cương vàng chỉ ra một động thái tăng tạm thời trái với xu hướng.
Chữ X đỏ đáng tin cậy nhất khi nó xuất hiện sau kim cương đỏ và dải EMA gần như bị thu hẹp hoàn toàn, chuyển màu sang xám giảm giá. Độ chính xác của chỉ báo này thay đổi tùy theo khung thời gian.
Cơ chế Hoạt động và Nguồn gốc Tín hiệu
Các biểu tượng và tín hiệu trong Market Cipher A được tạo ra dựa trên nhiều nguồn: các điểm giao cắt sóng WaveTrend, các mức quá mua và quá bán, và dựa trên RSI và MFI khi chúng cắt đường trung tâm hoặc đạt điều kiện quá mua và quá bán. Phân tích đa chiều này làm cho các tín hiệu toàn diện hơn so với các chỉ báo đơn lẻ.
Dải EMA bao gồm 8 đường trung bình động tạo thành một dải đặc trưng với sự tách biệt giữa các dải riêng lẻ. Sự tách biệt của các dải là yếu tố quan trọng - tách biệt rộng cho thấy xu hướng mạnh, trong khi các dải bị thu hẹp cho thấy động lượng yếu đi hoặc sự tích lũy.
Ứng dụng Thực tiễn trong Chiến lược Giao dịch
Market Cipher A được thiết kế chủ yếu như một công cụ phân tích xu hướng, vì vậy nó hoạt động tốt nhất trong các chiến lược theo xu hướng. Khuyến nghị sử dụng dải cùng với các chỉ báo nhận dạng xu hướng khác, sau đó tìm kiếm cơ hội giao dịch trong các đợt điều chỉnh giá.
Điều quan trọng là nhớ rằng các tín hiệu này giúp tinh chỉnh thời điểm vào hoặc thoát lệnh, nhưng không nên dùng riêng để ra quyết định giao dịch. Cần có các xác nhận bổ sung, đặc biệt đối với các tín hiệu đảo chiều xảy ra trong các chuyển động giá đi ngang.
Tóm tắt
The indicator automatically displays distinct symbols on the price chart to signal potential trading opportunities:
- Blue Triangle: signals declining momentum and possible trend reversal.
- Green Circle: indicates a bullish trend start, most reliable on 6-hour timeframes and above.
- Yellow Diamonds: suggest continuation of an upward trend.
- Red Diamonds: indicate trend weakening and potential downward continuation.
- Red X: bearish signal effective on 1-hour timeframes and higher.
- Yellow X: points to market manipulation events.
- Large Red Diamond ("Blood Diamond"): strong bearish signal with high probability of decline.
Signals are generated using a combination of WaveTrend crossovers, RSI, and MFI indicators, providing multidimensional market analysis. Market Cipher A is optimized for use with Heiken Ashi candles and is best applied within trend-following strategies, ideally combined with other Market Cipher indicators for enhanced entry and momentum confirmation.
Đánh giá của khách hàng
5 | 67 % | |
4 | 33 % | |
3 | 0 % | |
2 | 0 % | |
1 | 0 % |


