
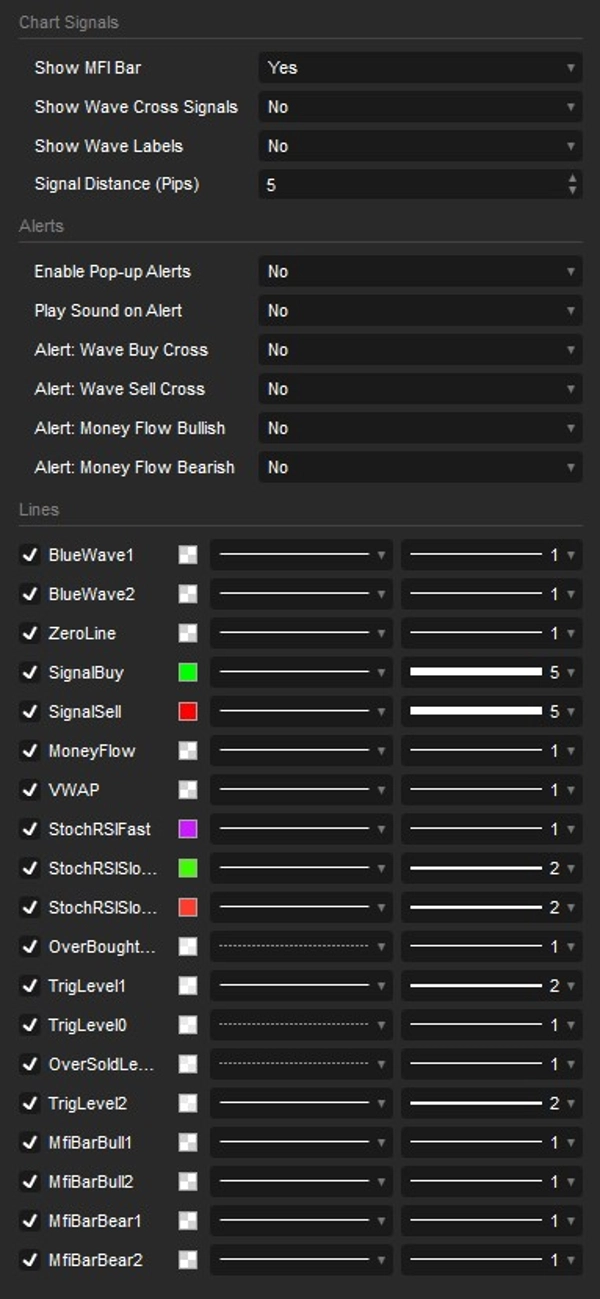
说明
展示:
Market Cipher B 是一个强大且用户友好的技术分析指标,旨在帮助您在金融市场中做出自信的交易决策——从加密货币到股票和外汇。无论您是初学者还是经验丰富的交易者,这个振荡器都能提供清晰的买入和卖出信号,让您轻松驾驭波动的市场,获得优势。
为什么选择 Market Cipher B?
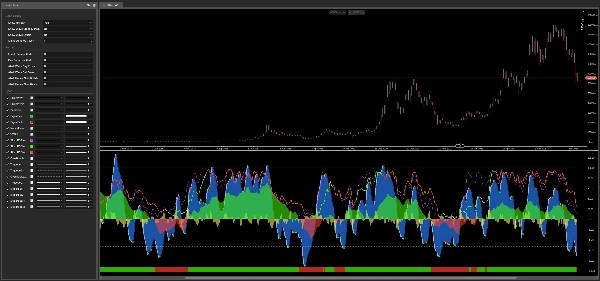
1. 清晰的买入和卖出信号 该指标通过易于阅读的信号准确定位最佳进出点。绿色点表示买入机会,红色点表示卖出时机。这使得任何人都能快速且果断地行动,即使没有深入的技术知识。
2. 蓝色波浪——市场动量一目了然 Market Cipher B 使用两条动态蓝色波浪线,揭示市场是正在增强还是失去动力。它们的交叉点突出显示关键时刻,帮助捕捉新兴趋势或避免潜在损失。波浪系统构成了指标的核心引擎,为所有其他信号提供可靠基础。
3. 波浪动量差——您的方向指南针 黄色线表示两条蓝色波浪之间的差距,作为实时动量的测量。当它升至零以上时,买方占据主导;当它跌至零以下时,卖方占优。这帮助您即时判断趋势是否有足够动力,或接近疲软和潜在反转。
4. 资金流向——追踪资金去向 绿红相间的资金流线揭示投资者资金的流向。作为一个经过平滑处理的60周期振荡器,它显示机构或大规模参与者何时进入或退出市场。零线以上和以下的交叉尤为重要,常常预示重大价格变动,给予您有意义的领先优势。
5. MFI 条——即时资金流信号 指标面板底部显示的彩色条形图直观展示当前资金流方向。绿色条表示多头资金占优,红色条表示空头压力。条形颜色的变化立即突出潜在趋势反转,无需任何数字分析——使其成为指标中最快的视觉提示之一。
6. 随机 RSI——精准时机把握 紫色的随机 RSI 线配合绿红色的慢速 RSI 线,帮助您高精度识别超买(可能价格过高)或超卖(可能价格过低)的市场状况。双速设计——快速线(40周期)和慢速线(81周期)——让您区分短期噪音和真实动量变化,非常适合寻找高概率反转点,避免常见市场陷阱。
7. 智能提醒系统——绝不错过任何信号 Market Cipher B 包含一个完全可配置的通知系统,即使您离开屏幕也能保持信息畅通。您可以独立启用或禁用四个关键事件的弹出提醒和声音通知:波浪买入交叉、波浪卖出交叉、资金流上穿零线(看涨)和资金流下穿零线(看跌)。每种提醒类型均可单独切换,让您完全掌控交易策略中最重要的内容。
8. 灵活性与自定义 Market Cipher B 可无缝适用于 cTrader 中的任何市场和时间框架——从一分钟剥头皮图表到每周波段交易视图。您可以完全控制显示哪些组件,包括 MFI 条、波浪交叉信号、信号标签(价格图上的买/卖文字)以及所有提醒类型。这种模块化设计意味着您可以根据自己的交易风格定制指标,避免视觉杂乱。
Market Cipher B 适合谁?
新手交易者 会欣赏直观的买卖信号、颜色编码的视觉效果和清晰的参考水平,使他们无需多年技术分析经验即可轻松开始交易。指标以视觉方式传达结论,让您花更少时间阅读数字,更多时间把握机会。
经验丰富的投资者 会发现高级组件——资金流、波浪动量差和双重随机 RSI——共同提供多层次的市场结构视角,适合复杂且高信念的策略。
日内和波段交易者 受益于指标的时间框架灵活性和快速信号生成,能够利用快速的日内波动和更长期的方向性趋势,无需在多个工具间切换。
摘要
客户评价
5 | 67 % | |
4 | 33 % | |
3 | 0 % | |
2 | 0 % | |
1 | 0 % |


!["Smart Money Concepts (SMC) [Iridio Capital]" 标识](https://cdn.ctrader.com/image/webp/28b69fd1-ef54-4bed-9487-07e78e883be4_40934)


