
说明
展示:
RSI 指标 - 该指标是经典相对强弱指数(RSI)振荡器在 cTrader 平台上的高级且简洁实现。它严格按照 TradingView 原始指标(基于其官方规范)开发。
得益于 RMA(运行移动平均)平滑模型的使用,该指标的行为和绘图完全与 TradingView 对应指标一致。我们还确保了完全匹配的视觉体验。
主要特点和功能:
- 100% 兼容 TradingView: 算法使用与原始 TV 指标完全相同的计算逻辑(基于 RMA 公式)。
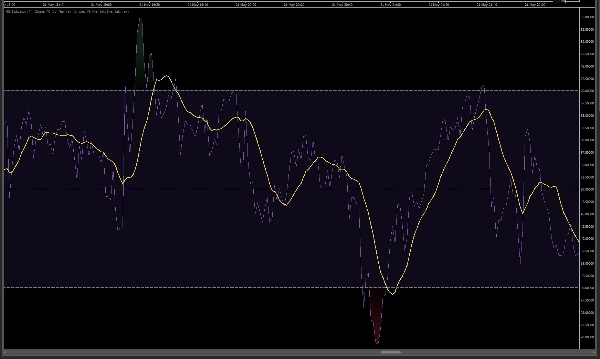
- 惊艳的视觉设计(动态渐变): 采用创新的 30 级颜色阴影系统。RSI 越向超买区(70 以上)移动,红色背景越加浓烈。越向超卖区(30 以下)下降,绿色越深。中间区间保持经典紫色调。
- 内置移动平均线(MA): 如最新的 TV 版本,您可以启用移动平均线(例如 SMA),平滑 RSI 线,帮助识别振荡器内的趋势。
- 自动背离检测: 指标可以自动扫描图表中的常规背离。当检测到价格与 RSI 趋势强度不匹配时,会在指标窗口直接绘制线条和标记(看涨:绿色,看跌:红色)。
- 强大的提醒系统(弹窗和声音): 随时保持更新。指标将在以下情况通知您:
-
- RSI 退出超买/超卖区(生成经典买入/卖出信号),
- RSI 线在这些区域内深度穿越 MA 线,
- 检测到新的背离。
此指标适合谁?
如果您习惯于在 TradingView 上分析 RSI,寻找在 cTrader 中完美匹配的信号,并且重视简洁且视觉吸引力强的设计(无需手动调整颜色),此指标是理想的解决方案。
使用简单,操作精准,忠于原作!
cGuru
摘要
AI 摘要
The RSI Indicator is a cTrader implementation of the classic Relative Strength Index oscillator, designed to replicate TradingView’s original indicator using the Running Moving Average (RMA) smoothing method. It provides 100% calculation compatibility with TradingView, ensuring identical signal behavior and visual presentation. Key features include a dynamic 30-level gradient color scheme that visually distinguishes overbought (red) and oversold (green) zones, with a neutral purple mid-range. The indicator supports an optional moving average line (e.g., SMA) to smooth the RSI curve and highlight trends within the oscillator. It also offers automatic detection of regular divergences between price and RSI trends, marking bullish and bearish divergences directly on the chart. A built-in alert system notifies users via pop-up and sound when the RSI exits overbought/oversold zones, crosses the moving average within these zones, or when new divergences are detected. This indicator is suitable for traders familiar with TradingView’s RSI who seek an accurate, visually clear, and feature-rich RSI tool within the cTrader platform.
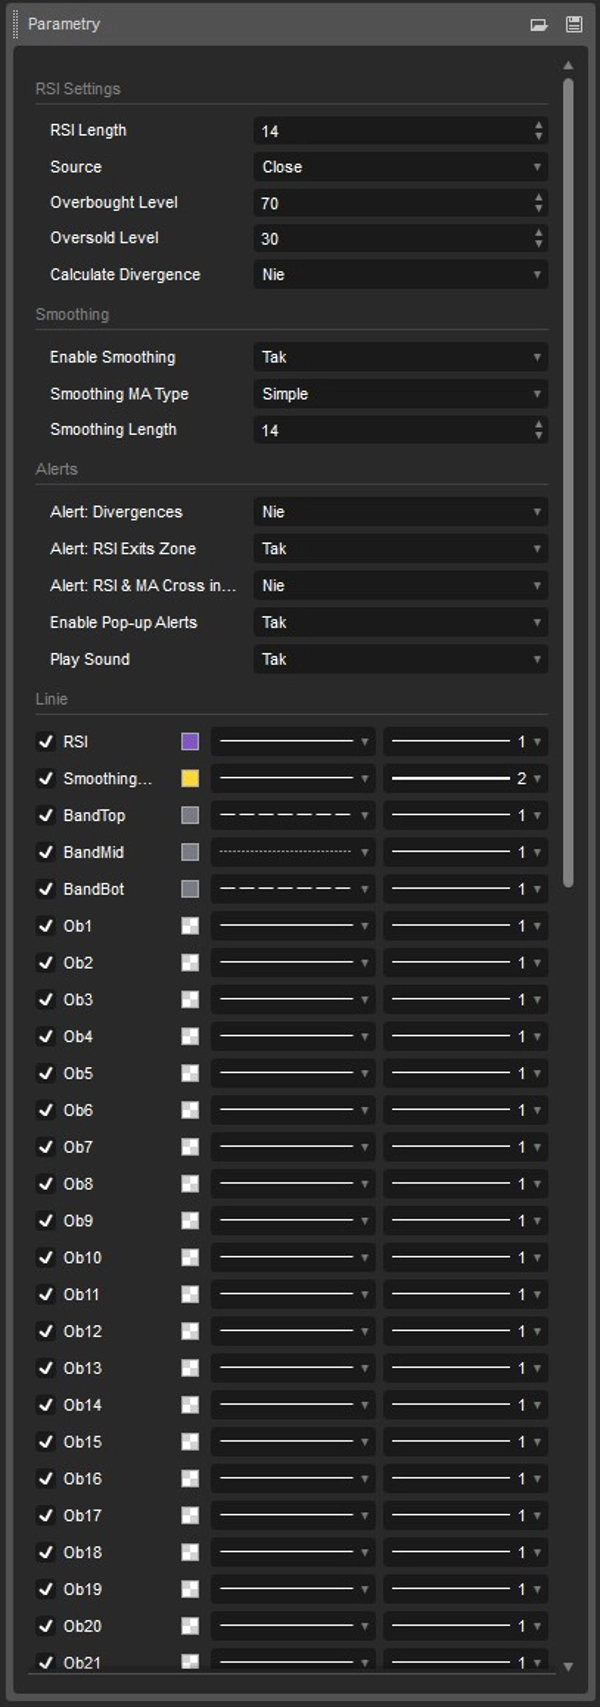
指标配置
指标分类
支撑与阻力
输出类型
可视化
数据要求
跳动点数据
支持的信号
反转
背离
客户评价
0.0
评价:0
客户评价
该产品尚无评价。已经试过了?抢先告诉其他人!
讨论
常见问答
SMA
RSI
Moving Average
cTrader Store 提供的所有产品,包括交易机器人、指标和插件,均由第三方开发者提供,仅供信息参考和技术访问之用。cTrader Store 并非经纪商,不提供投资建议、个人推荐或任何未来业绩保证。


猜您喜欢


价格
88
销售
149
免费安装