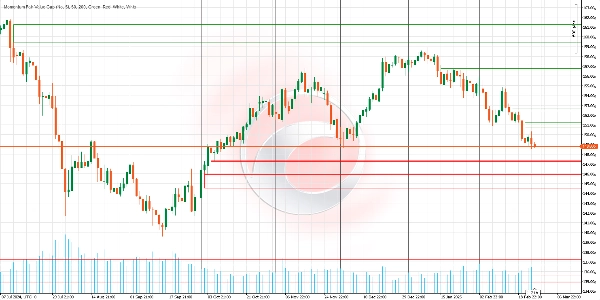
经纪商和自营
面向企业
00
Days
:
00
Hours
:
00
Minutes
:
00
Seconds
Momentum Fair Value Gap
指标
1 购买
Version 1.0, Feb 2025
Windows, Mac
注册日期 03/10/2024
销售
135
免费安装
27975
"Momentum Fair Value Gap" 已上传图片"Momentum Fair Value Gap" 已上传图片"Momentum Fair Value Gap" 已上传图片

It identifies areas of market imbalance (Fair Value Gaps or FVGs) and projects them on the chart in a smart way. Unlike other indicators, this one adapts in real-time to price action, adjusting its size, persistence, and relevance. It's ideal for traders seeking clear targets and advanced visual gap management.

KEY FEATURES

  1. Dynamic Gap Adjustment
    Logic: If the price partially touches an FVG (e.g., grazes the lower boundary), the indicator automatically resizes the gap to reflect only the uncovered area.
    Benefit: Avoids false signals and keeps only gaps with real potential active.
  2. MidPoint Fill
    Logic: Draws a line at the center of the gap. If the price touches it, the FVG is considered "filled" and can be removed (configurable).
    Benefit: Requires only 50% contact to confirm closure, filtering noise and premature trades.
  3. Infinite Projection Until Filled
    Logic: Gaps extend into the future indefinitely (they don't disappear after X candles).
    Benefit: Provides persistent reference until the market resolves the imbalance.
  4. Automatic Cleanup of Invalidated Gaps
    Logic: Automatically removes old gaps when they are fully filled.
    Benefit: Keeps the chart clean and focused on active zones.
  5. Advanced Visual Customization
    Options: Different colors for bullish (green) and bearish (red) gaps. Transparency adjustment to avoid chart clutter.
    Benefit: Adapts to any trading style or visual strategy.

🎯 HOW TO USE IT IN TRADING?

Identification of Key Zones:

  • Bullish FVG (Green): Area where buyers temporarily lost strength.
    → Strategy: Look for buying opportunities during pullbacks to this zone.
  • Bearish FVG (Red): Area where sellers were overtaken.
    → Strategy: Look for selling opportunities during rallies to this zone.

Interaction with Price:

  • If the gap adjusts dynamically (reduces its size), it indicates that the market is testing the zone but without confirmation.
  • If the gap is removed (by full fill or MidPoint), consider the imbalance corrected.

🔍 CONFIRMATION WITH OTHER TOOLS

Combine FVGs with supports/resistances, volume, or RSI to filter signals.

📋 FEATURE COMPARISON

___________________________________________________________________________________

Feature Momentum Fair Value Gap Traditional Indicators

________________________________________________________________________________

Persistence---------------- Extends gaps until filled ----------------------- Disappear after X candles

Closure Precision-------- 50% confirmation option --------------------- Requires full gap fill

Flexibility ------------------ Resizes with price ------------------------- Static and immutable levels

Visual Focus---------------- Removes irrelevant gaps ----------------------- Clutters chart with past data


📝 PRACTICAL EXAMPLE

Scenario in EURUSD (1H):
A Bullish FVG (green) forms after a pronounced bearish candle. Days later, the price retraces, touching the lower boundary of the gap but doesn’t fill it. The indicator automatically reduces the gap size. Finally, the price touches the MidPoint (centerline), triggering its removal. The trader goes short after confirming rejection in the zone.


Ctrader Store indicators:


Channel Breakout System

Fair Value Gap Sessions

 BOS & CHOCH

ZigZag

Supertrend

Market Imbalance

Adaptive Trend Channel 

Dynamic Market Structure
Analysis of Turning Points

Order Block

Fibonacci Linear
Regression Multi-timeframe

Volume POC Heatmap

Dynamic RSI

Momentum Fair Value Gap

Market Flow Projection

Dynamic Trend Gradient

Multi-Level Candle Bias
Tracker

Zig-Zag Extremity Tracker

Reactive Moving Average

Auto-Trend Channel

Auto Support and
Resistance Trend Lines

All Support and
Resistance Levels

Leverage Liquidation Map

Zones Supply Demand

Dynamic Range Momentum

0.0
评价:0
客户评价
该产品尚无评价。已经试过了?抢先告诉其他人!
RSI
Breakout
Supertrend
EURUSD

该作者的其他作品

评分最高
免费
指标
RSI
XAUUSD
Breakout
+6
ZigZag
ZigZag filters noise, spots trends, patterns, pivots, aiding analysis, trade management, and confirmations. 📉📈
指标
RSI
XAUUSD
Breakout
+6
Order Block
Identify bullish and bearish Order Blocks to spot key support/resistance levels and potential trend reversals! 📈🔄
指标
RSI
Breakout
XAUUSD
+5
Auto-Trend Channel
Adaptive trend channel using linear regression and Pearson correlation for dynamic support, resistance, and trends.
指标
RSI
XAUUSD
Breakout
+5
BOS & CHOCH
Market structural patterns , specifically the concepts of Change of Character (ChoCH) 🔄 and Break of Structure (BoS) 💥
指标
RSI
Breakout
XAUUSD
+6
Volume POC Heatmap
📊 Shows volume by price levels, highlights POC, and key zones. Identifies dynamic support/resistance and imbalances.
指标
RSI
Breakout
Supertrend
All Support and Resistance Levels
"Identify key market zones and visualize support/resistance from multiple timeframes on a single chart.
指标
RSI
Breakout
XAUUSD
+5
Zones Supply Demand
📊Zones Supply & Demand: Identifies key price levels with high volume concentration, marking Supply/Demand Zones & Marke
指标
RSI
Breakout
XAUUSD
+5
Supertrend
💹 Define a price channel 📈 and determine trend direction (bullish 🟢 or bearish 🔴).
指标
RSI
Breakout
XAUUSD
+6
Fair Value Gap Sessions
identify and highlight temporary market inefficiencies known as "fair value gaps" 🚨 within specific trading Sessions.
指标
RSI
Breakout
XAUUSD
+4
Dynamic Market Structure Analysis of Turning Points
Identify market structure effortlessly with swing highs, lows, CHoCH, and BOS levels for smart trading decisions! 📊🔍"
指标
Indices
RSI
XAUUSD
+7
RSI Divergence
Detects bullish and bearish divergences
指标
RSI
Breakout
Supertrend
Trend Heikin Multi MA
🚀 TrendHeikinMultiMA: Advanced trend detection using Heikin-Ashi smoothing & MAs! Eliminates noise, confirms real trend

猜您喜欢

指标
NAS100
XAUUSD
Breakout
+10
VWAPSigmaBandPRO_Max
Professional VWAP + Sigma Bands. Auto signals, 3 modes, live stats, multi-level entry/exit. Proven volume-based system.
指标
Fibonacci
Advanced Regression Channel
Regression channels with Fibonacci levels across multiple regression types, timeframes, and custom date ranges.
指标
NAS100
NZDUSD
XAUUSD
+11
Samurai Breakout Lite
⚔️Limited version. Draws clean session box (Tokyo / London / New York / Overlap) and optional breakout plan (EP/TP/SL)⚔️
指标
Forex
EURUSD
USDJPY
4 Currencies_NSC
Relative Currency Strength: AUD,USD,EUR,JPY. See which is stronger! Better pair picks. Better Trades!
指标
Stocks
Commodities
Forex
+1
CicloQuatroVelas
Ciclo4Velas com marcação de 50% da amplitude e muito mais ! veja na descrição e bons trades.
指标
Indices
Prop
Breakout
+6
ICT Order Block Advanced
Area of Interest
Area of Interest with the power of AI to detect the market interest.
指标
NAS100
NZDUSD
XAUUSD
+10
Candle Count
Label each candle sequentially with flexible session resets.
指标
VWAP
VolumeRenkoRange
Volume for Renko/Range
指标
NAS100
NZDUSD
Martingale
+26
Kalman Filter Trend
Smarter trend detection with zero unnecessary lag.
指标
Supertrend
Supertrend Moving Average
Adaptive MA anchored to structural trend changes — no fixed period. Dual Supertrend + swing detection.
指标
NAS100
NZDUSD
Martingale
+25
Volume Profile Suite trial7D
DEMO VERSION 7 DAYS VolumeProfileSuite is an advanced and flexible Volume Profile indicator for cTrader.