คำอธิบาย
ตัวชี้วัด Pinescriptlabs Store: Pinescriptlabs Store cBots : (cBot) Gold & BTC BreakoutSession Pivots(ใหม่)
โครงสร้างตลาดขั้นสูง: Bos, Choch, SwinLevels, Order Blocks, Market Structure & Liquidity Finder (ใหม่)
การคาดการณ์สภาพคล่องราคา ZigZag
อัลกอริทึมสมาร์ทติดตาม (ใหม่)
SmartTrend Support &
Resistance
Lines
ช่องว่างมูลค่ายุติธรรมของเซสชัน
การวิเคราะห์
โครงสร้างตลาด
แบบไดนามิก
ของ
จุดเปลี่ยน
Points
ฟีโบนัชชี
การถดถอยเชิงเส้น
หลายกรอบเวลา
Multi-timeframe
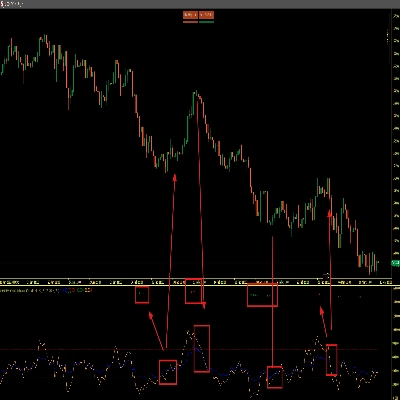
ช่องว่างมูลค่ายุติธรรมโมเมนตัม
ตัวติดตาม
แนวโน้มแท่งเทียนหลายระดับ
Tracker
แนวรับและ
แนวต้านอัตโนมัติ
แนวโน้ม
Lines
ระดับ
แนวรับและ
แนวต้านทั้งหมด
Levels
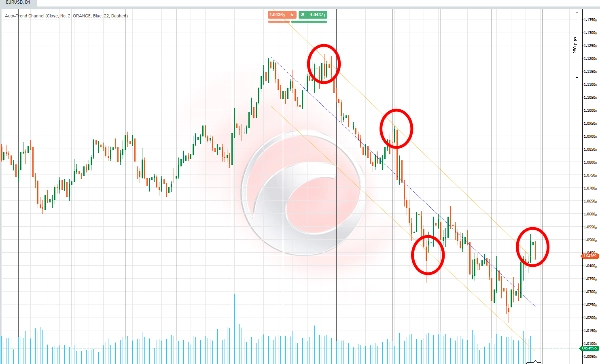
📊 ช่องแนวโน้มอัตโนมัติ 📊
ตัวชี้วัดนี้แสดงช่องแนวโน้มโดยอิงจากการคำนวณการถดถอยเชิงเส้นและส่วนเบี่ยงเบนมาตรฐานของข้อมูลราคา (แบบลอการิทึม) สำหรับช่วงเวลาที่เลือกโดยอัตโนมัติ 📈 ช่วงเวลาจะถูกกำหนดโดยใช้ สัมประสิทธิ์สหสัมพันธ์เพียร์สัน (RRR) โดยเลือกค่าที่มีค่าสัมบูรณ์สูงสุด 🧮
✨ ฟังก์ชันหลัก ✨
ฟังก์ชันหลักคือการคำนวณช่องแนวโน้มที่ปรับตัวโดยอัตโนมัติตามความยาวช่วงเวลาที่เป็นตัวแทนมากที่สุด โดยใช้สถิติขั้นสูงเพื่อกำหนด แนวรับ, แนวต้าน และ เส้นแนวโน้มกลาง.
ช่องประกอบด้วย:
1️⃣ เส้นฐาน ที่แสดงแนวโน้มเชิงเส้นที่คำนวณได้
2️⃣ เส้นบนและล่าง ที่กำหนดขอบเขตช่องในระยะห่างที่สัมพันธ์กับส่วนเบี่ยงเบนมาตรฐาน
🚀 คุณสมบัติและการคำนวณ 🚀
🔎 การคำนวณช่วงเวลาที่เหมาะสม
- ตัวชี้วัดประเมินช่วงเวลาข้อมูลหลายช่วง (สั้นหรือยาว ขึ้นอยู่กับการตั้งค่า) เพื่อค้นหาช่วงเวลาที่มีความสัมพันธ์กับพฤติกรรมตลาดที่แม่นยำที่สุด
- ใช้ สัมประสิทธิ์สหสัมพันธ์เพียร์สัน เป็นตัวชี้วัดหลักเพื่อระบุช่วงเวลาที่มีความสัมพันธ์ที่แข็งแกร่งที่สุดระหว่างราคาประวัติศาสตร์และเส้นแนวโน้มที่สร้างขึ้น
📐 การถดถอยเชิงเส้นและการคาดการณ์ราคา
- สำหรับแต่ละช่วงเวลาที่ประเมิน จะคำนวณเส้นถดถอยโดยอิงจากลอการิทึมธรรมชาติของราคาเพื่อทำให้ความผันผวนสุดขั้วมีความเสถียร
- ส่วนประกอบสำคัญของการคำนวณประกอบด้วย:
-
- ความชัน: แสดงอัตราการเปลี่ยนแปลงของราคา
- จุดตัดแกน: จุดเริ่มต้นของเส้นที่คาดการณ์
- ค่าเฉลี่ย: กำหนดเส้นฐานอ้างอิง
📊 ส่วนเบี่ยงเบนมาตรฐานและขอบเขตช่อง
- คำนวณส่วนเบี่ยงเบนมาตรฐานของราคาที่สัมพันธ์กับเส้นถดถอย
- เส้น ขอบบน (แนวต้าน) และ ขอบล่าง (แนวรับ) ได้มาจากการปรับเส้นกลางด้วยตัวคูณส่วนเบี่ยงเบนมาตรฐานที่ผู้ใช้กำหนดได้
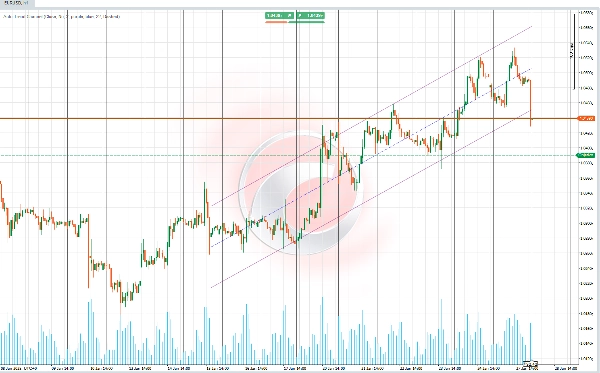
🌈 การแสดงผลช่องแนวโน้ม
- ช่องประกอบด้วยองค์ประกอบหลักสามส่วน:
-
- เส้นกลาง: แสดงแนวโน้มหลักตามเส้นถดถอย
- เส้นบน: แสดงขอบเขตบนของช่อง (แนวต้าน) ปรับด้วยส่วนเบี่ยงเบนมาตรฐาน
- เส้นล่าง: แสดงขอบเขตล่างของช่อง (แนวรับ) ปรับด้วยส่วนเบี่ยงเบนมาตรฐาน
- ผู้ใช้สามารถปรับแต่ง สี, ความโปร่งใส และรูปแบบเส้นเพื่อความชัดเจนในการมองเห็น
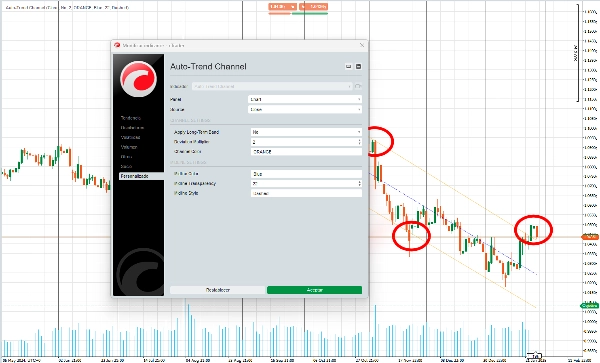
🎛️ ความสามารถในการปรับตัวและการตั้งค่า
- ผู้ใช้สามารถปรับแต่งแง่มุมต่าง ๆ ของตัวชี้วัด เช่น:
-
- สี ของเส้นและช่อง
- ว่าจะเน้นที่ ช่วงเวลายาว (แนวโน้มมหภาค) หรือ ช่วงเวลาสั้น (แนวโน้มจุลภาค)
- ความสามารถในการปรับตัวนี้ช่วยให้ตัวชี้วัดเหมาะกับสไตล์การเทรดและความชอบในการมองเห็นที่แตกต่างกัน
🔍 การใช้งาน :
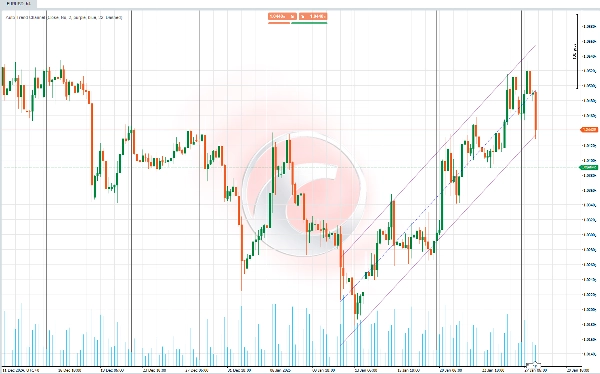
1️⃣ การระบุแนวโน้ม
- เส้นกลางของช่องช่วยกำหนดว่าตลาดอยู่ใน แนวโน้มขาขึ้น, แนวโน้มขาลง หรือ แนวโน้มด้านข้าง.
2️⃣ แนวรับและแนวต้านแบบไดนามิก
- เส้นบนและล่างของช่องทำหน้าที่เป็นโซนที่ราคาอาจ กลับตัว หรือ รวมตัว.
3️⃣ การตรวจจับการรวมตัวและเบรกเอาต์
- ราคาที่อยู่ภายในช่องบ่งชี้ถึงการ รวมตัว ขณะที่การเบรกเอาต์บ่งชี้ถึง การเปลี่ยนแปลงแนวโน้ม หรือการเคลื่อนไหวของราคาที่ รุนแรง.
4️⃣ การปรับให้เหมาะกับสไตล์การเทรดที่แตกต่างกัน
- ช่วงเวลายาว เหมาะสำหรับการระบุแนวโน้มทั่วไปและการตัดสินใจเชิงกลยุทธ์ในกรอบเวลาที่กว้างขึ้น
- ช่วงเวลาสั้น ช่วยให้เทรดเดอร์จับการเคลื่อนไหวที่เร็วขึ้นและตอบสนองต่อการเปลี่ยนแปลงตลาดทันที
สรุป
Key features include:
- Optimal period selection by evaluating multiple data intervals to find the strongest correlation between historical prices and the trend line.
- Calculation of slope, intercept, and mean for precise linear regression and price projection.
- Visualization of the trend channel with customizable colors, transparency, and line styles.
- Adaptability for different trading styles by allowing focus on long-term (macro) or short-term (micro) trends.
Use cases:
- Identifying market trends (uptrend, downtrend, sideways) via the central trend line.
- Detecting dynamic support and resistance zones where price may reverse or consolidate.
- Recognizing consolidation phases within the channel and breakouts signaling trend changes or strong price movements.
- Adjusting analysis to suit strategic decisions or faster market responses depending on selected period length.
This indicator supports various markets including cryptocurrencies (BTCUSD), commodities (XAUUSD), and others, providing a statistical approach to trend and channel analysis.
รีวิวจากลูกค้า
5 | 60 % | |
4 | 20 % | |
3 | 20 % | |
2 | 0 % | |
1 | 0 % |


!["Smart Money Concepts (SMC) [Iridio Capital]" โลโก้](https://cdn.ctrader.com/image/webp/28b69fd1-ef54-4bed-9487-07e78e883be4_40934)