present
Registrieren Sie sich und erhalten Sie $50 Rabatt auf Ihren ersten Kauf
Trading product for Supertrend Indikator BTCUSD Breakout, image 1
Supertrend
4.3
Bewertungen: 3
Seit 03/10/2024
178
Verkäufe
45.51K
Kostenlose Installationen

Beschreibung

Pinescriptlabs Store Indikatoren:                        Pinescriptlabs  Store cBots :  (cBot) Gold & BTC BreakoutSession Pivots(neu)

PRICE ACTION  (Neu)

Trailing Smart Algorithmus (neu)

S&R Struktureller ZigZag                                

ZigZag

 BOS & CHOCH

Zonen Angebot Nachfrage

Hebel Liquidationskarte

Auto-Trend Kanal


Volumen POC Heatmap


PREMIUM SSL KANAL

Vorhersage basierend auf Linreg & ATR

 ICT Power of 3 
                                                   

SmartTrend Unterstützung &
Widerstand
Linien
       

Fair Value Gap Sitzungen                


RSI Trend Trigger

Kanal Ausbruch System

Supertrend

Marktungleichgewicht

Adaptiver Trend Kanal 

Dynamische
Marktstruktur
Analyse
von
Wendepunkten
Punkten

Order Block

Fibonacci
Lineare
Regression
Multi-Zeitrahmen

Dynamischer RSI

Momentum Fair Value Gap

Marktfluss Projektion

Dynamischer Trend Gradient

Multi-Level
Kerzen Bias
Tracker

Zig-Zag Extremitäten Tracker

Reaktive Gleitender Durchschnitt

Auto
Unterstützung und
Widerstand
Trend
Linien

Alle
Unterstützungs- und
Widerstandsniveaus
Level

Dynamisches Range Momentum

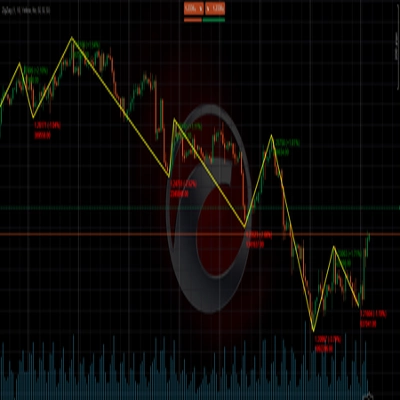
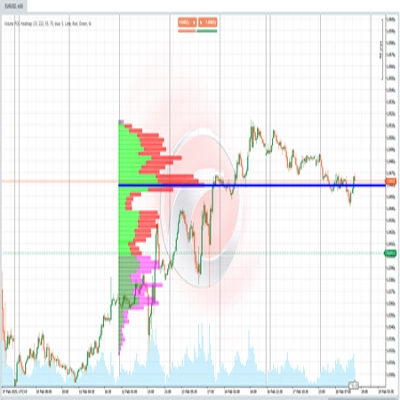
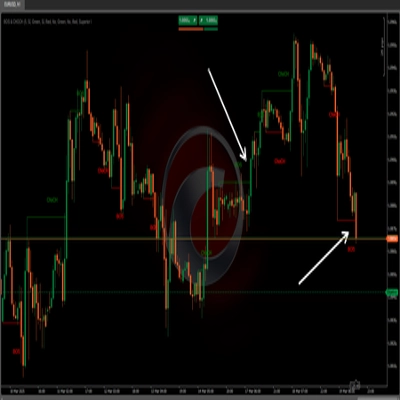
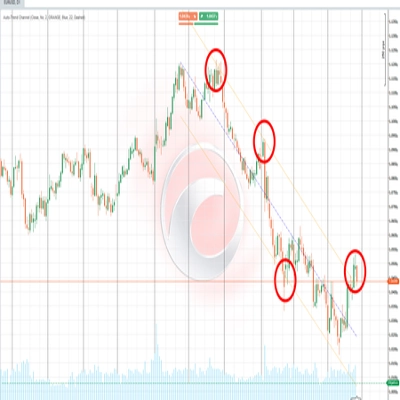
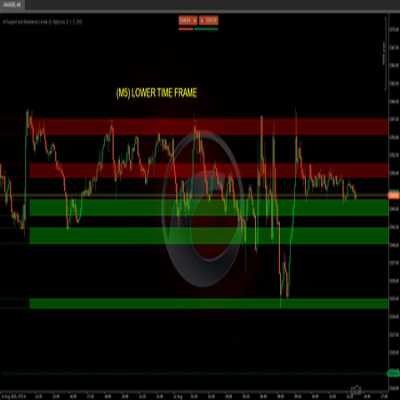
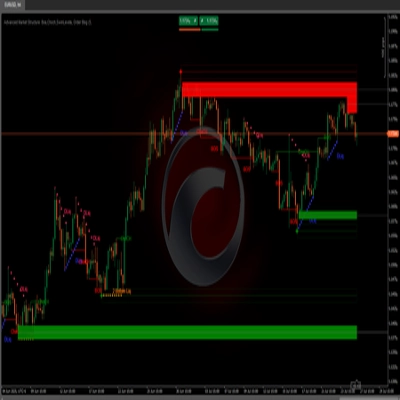
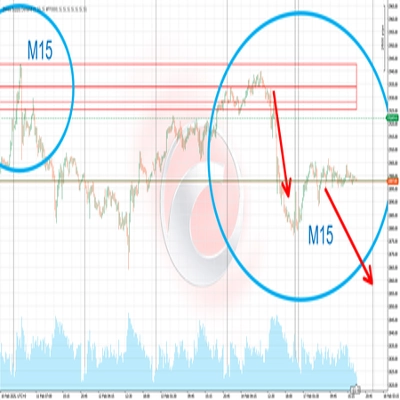
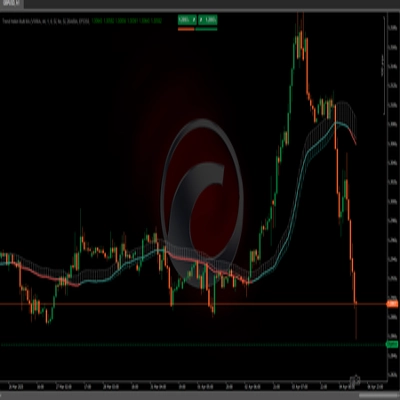
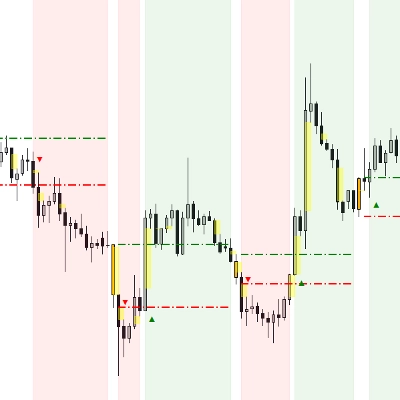
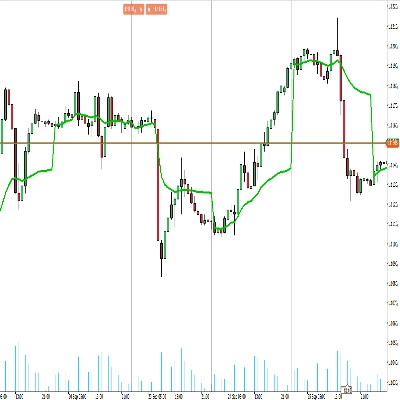
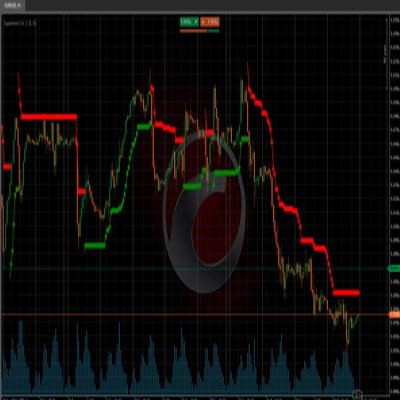
🚀 **Trendfolgender Algorithmus**, der die **Average True Range (ATR)** 📊 nutzt, um einen Preiskanalkanal 📈 zu definieren und die Trendrichtung (bullisch 🟢 oder bärisch 🔴) zu bestimmen. Der Indikator ändert die Farben und zeichnet Linien basierend auf dem Trend, was es einfach macht, Verschiebungen im Marktmomentum zu visualisieren. 💹


### 🔧 **Eingaben**:


1. **ATR Perioden** ⏳:

- Definiert die Anzahl der Perioden zur Berechnung der **Average True Range**. Dies beeinflusst die Empfindlichkeit des Indikators und hilft Ihnen, Marktbewegungen schneller oder langsamer zu erfassen.


2. **ATR Multiplikator** 🔍:

- Passt den Abstand zwischen den Trendlinien 📉 basierend auf der Marktvolatilität 🌊 an. Ein höherer Wert erweitert den Kanal, reduziert Fehlsignale, bietet aber eine klarere Sicht auf größere Marktbewegungen. 📐


Zusammenfassung

KI-Zusammenfassung
The Supertrend indicator is a trend-following tool that uses the Average True Range (ATR) to define a dynamic price channel and identify market trend direction as bullish or bearish. It visually represents trend shifts by changing colors and drawing lines on the price chart, facilitating the recognition of momentum changes. Key adjustable inputs include the ATR Periods, which set the number of periods for ATR calculation affecting sensitivity, and the ATR Multiplier, which adjusts the channel width based on market volatility to balance signal accuracy and noise reduction. This indicator supports analysis across various markets including cryptocurrencies (e.g., BTCUSD), commodities (e.g., gold, XAUUSD), and others. It is designed to help traders visualize and follow prevailing trends by providing clear, adaptive trend signals derived from price action and volatility measures.
Indikatorprofil

Diskussion

Kundenbewertungen

4.3
Bewertungen: 3
5
33 %
4
67 %
3
0 %
2
0 %
1
0 %
Kundenbewertungen
October 6, 2024
Useful in the right hands if the trader wants it helps keep attention on the broader move. It works best as support, not a final decision maker. I would judge the trend read across 3 sessions, with at least 2 higher timeframe candles agreeing. sideways markets can weaken the signal.
October 5, 2024
October 5, 2024
Solid option for review for traders who prefer directional setups. It gives value around trend filtering, but sideways markets can weaken the signal. The signal feels safer when trend strength is clear and DD stays under 3 percent. It is a filter for bias, not a reason to ignore risk.

Häufig gestellte Fragen (FAQ)

BTCUSD
Breakout
Supertrend
Commodities
RSI
Crypto
XAUUSD
ATR
Über den cTrader Store verfügbare Produkte, einschließlich Handelsbots, Indikatoren und Plugins, werden von externen Entwicklern bereitgestellt und nur zu Informations- und technischen Zugriffszwecken verfügbar gemacht. cTrader Store ist kein Broker und erbringt keine Anlageberatung, persönlichen Empfehlungen oder eine Garantie für zukünftige Performance.

Mehr von diesem Autor

ZigZag filters noise, spots trends, patterns, pivots, aiding analysis, trade management, and confirmations. 📉📈
Identify bullish and bearish Order Blocks to spot key support/resistance levels and potential trend reversals! 📈🔄
📊 Shows volume by price levels, highlights POC, and key zones. Identifies dynamic support/resistance and imbalances.
Market structural patterns , specifically the concepts of Change of Character (ChoCH) 🔄 and Break of Structure (BoS) 💥
Adaptive trend channel using linear regression and Pearson correlation for dynamic support, resistance, and trends.
"Identify key market zones and visualize support/resistance from multiple timeframes on a single chart.
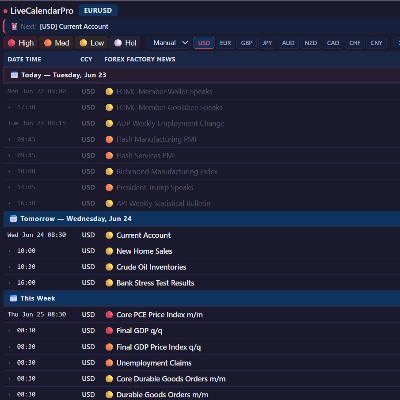
Displays live economic events directly inside your cTrader charts.
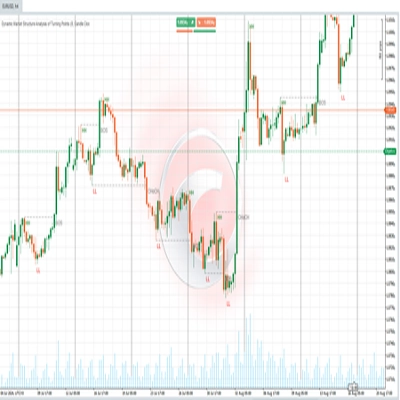
Identify market structure effortlessly with swing highs, lows, CHoCH, and BOS levels for smart trading decisions! 📊🔍"
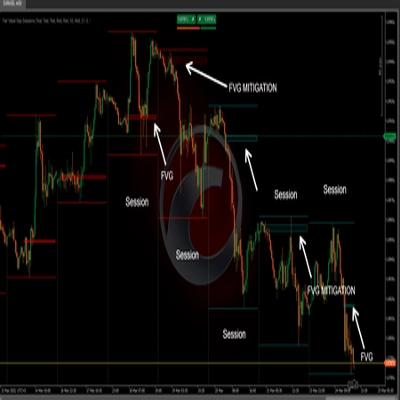
identify and highlight temporary market inefficiencies known as "fair value gaps" 🚨 within specific trading Sessions.
Advanced price action tool that combines multiple technical analysis concepts
📊Zones Supply & Demand: Identifies key price levels with high volume concentration, marking Supply/Demand Zones & Marke
🚀 TrendHeikinMultiMA: Advanced trend detection using Heikin-Ashi smoothing & MAs! Eliminates noise, confirms real trend

Das könnte Sie auch noch interessieren

Spots key hourly ranges and signals breakouts using arrows & colored background zones. Ideal for Gold.
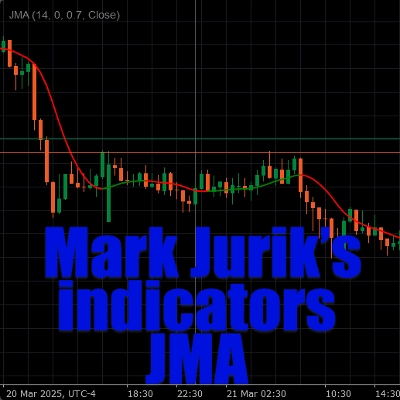
Jurik Moving Average (Jurik's Moving Average) triple adaptive filter with unique Jurik smoothing and dynamic factor.
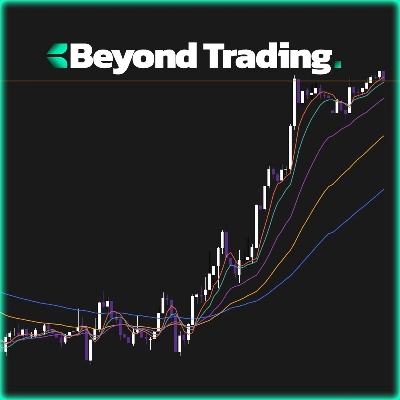
Multi EMA Timeframes lets you stay on your chart and see the exact EMA from any timeframe you choose — up to 5 at once.
EMA Clouds, Multi-Timeframe (MTF) Overlay, Swing High/Low detection, and a smart Dashboard with neutral zone filtering.
Trades Opening Range Breakouts Indicator with dynamic stops/targets adapting to market volatility.
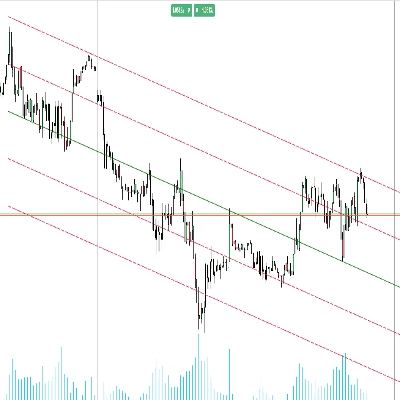
Visualize trends with Standard Deviation Channel! Display median, and add customizable upper/lower deviation channels.
GOLD SENTINEL v1.0 - A CANDLE-COLORING INDICATOR FOR GOLD.
Candle timer with live profit tracking on chart – displays pips, currency value, and percentage in real time.
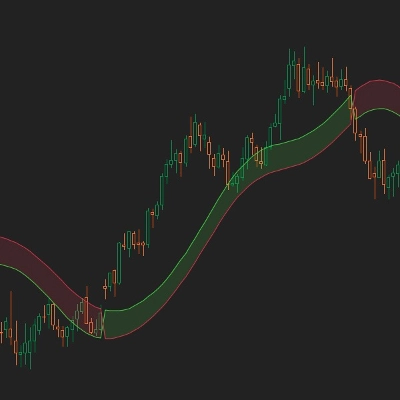
Trend-following channel using dual MAs with visual cloud and optional alerts on crossovers
🚀 Buy and sell signals 📈📉 only when three independent engines agree simultaneously.
Trading.FC$_vwap Algo shows VWAP trends, dynamic support/resistance and deviation bands to spot potential trade entries.
Advanced Anchored VWAP for cTrader: volatility bands, real‑time alerts & customizable session resets.
Bolliger Bands + Hamster-Coder™ Timeframe Decoupling
„MA Sabres“-Logo
4.2
(4)
$19
Conquer the markets with MA Sabres! This indicator spots trend flips with MAs and cool Sabre shapes & alerts.
Advanced market structure and institutional cycle mapper with visual reference cards and entry alerts
Perfect Entry Price designed to help traders identify the most accurate and reliable price levels for market entries
Enhance trading with ATR Bands! Visualize market volatility using dynamic upper and lower ATR bands for precise decision
Unlock VWAP in cTrader! Choose anchor periods, price sources, and display deviation bands with real-time tick updates.

Preis

Seit 03/10/2024
178
Verkäufe
45.51K
Kostenlose Installationen