
Beschreibung
📊 TrendHeikinMultiMA – Fortgeschrittener Trend-Algorithmus
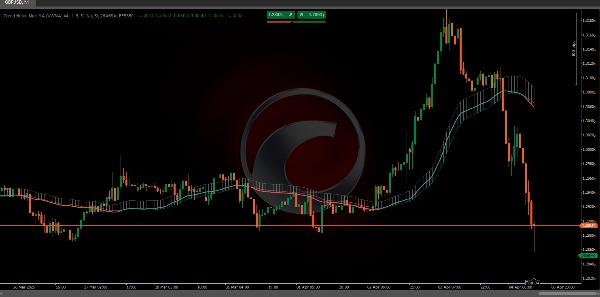
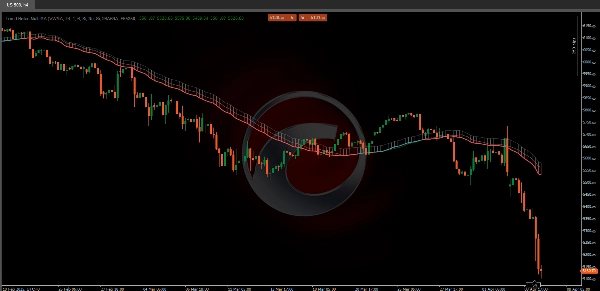
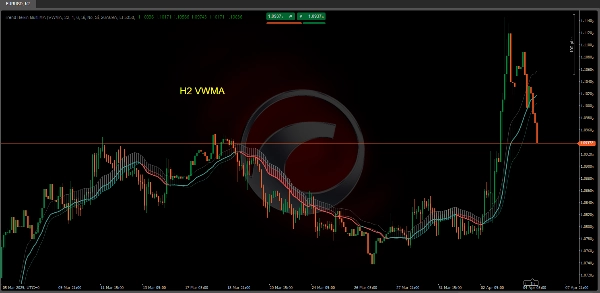
Der TrendHeikinMultiMA Algorithmus ist darauf ausgelegt, Trendwerte aus Preisdaten zu berechnen, wobei die Heikin-Ashi-Formel verwendet wird, um diese Werte zu glätten, und verschiedene Arten von gleitenden Durchschnitten (ALMA, HMA, SMA, SWMA, VWMA, WMA, ZLEMA oder EMA) angewendet werden.
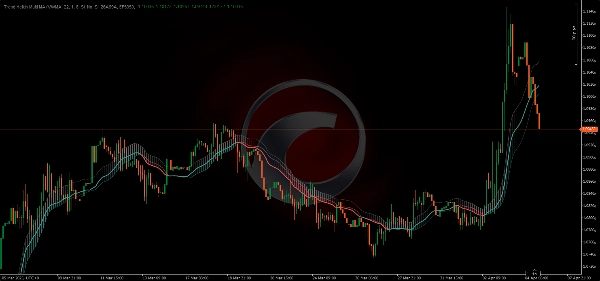
Obwohl Heikin-Ashi-Werte intern verwendet werden, zeigt das Chart keine traditionellen Heikin-Ashi-Kerzen an. Stattdessen werden Trendliniën basierend auf den geglätteten Werten gezeichnet, was die Marktrichtung leichter interpretierbar macht ohne die visuelle Komplexität von Kerzencharts.
🔄 1. Die Rolle der Glättung
Da die Trendwerte aus Heikin-Ashi-Glättung in Kombination mit einem gleitenden Durchschnitt abgeleitet werden, erfolgt die Farbänderung in TrendHeikinMultiMA nicht sofort, wenn der Preis die Trendlinie kreuzt:
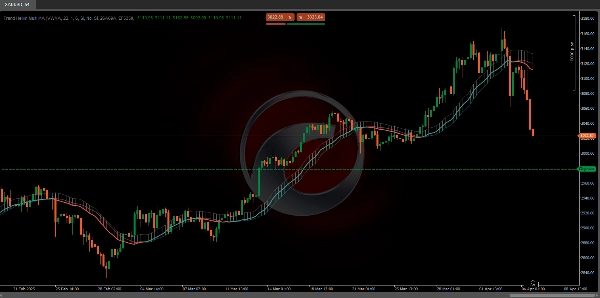
- 🔹 Der Preis kann vorübergehend über oder unter die Trendlinie bewegen ohne eine Farbänderung auszulösen.
- 🔹 Dies geschieht, weil der Indikator auf einen signifikanten und anhaltenden Unterschied zwischen den geglätteten Open- und Close-Werten wartet, um eine tatsächliche Trendwende zu bestätigen.
✅ Vorteil bei der Interpretation
Diese bewusste Verzögerung bei der Farbänderung hilft, Fehlsignale zu vermeiden. In einem traditionellen Kerzenchart könnte der Preis kurzzeitig die Trendlinie kreuzen und vorzeitige Signale auslösen.
- 🟥 Zum Beispiel bleibt der Indikator rot (bärisch), selbst wenn der aktuelle Preis über einer bärischen Trendlinie liegt, bis die geglätteten Werte bestätigen, dass der Close konsequent höher als der Open ist.
- 🟩 Ebenso muss der auf Heikin-Ashi basierende gleitende Durchschnitt bestätigen, dass der Close konsequent den Open übersteigt, um auf grün (bullisch) zu wechseln.
📈 2. Anwendung von gleitenden Durchschnitten auf Heikin-Ashi-Werte
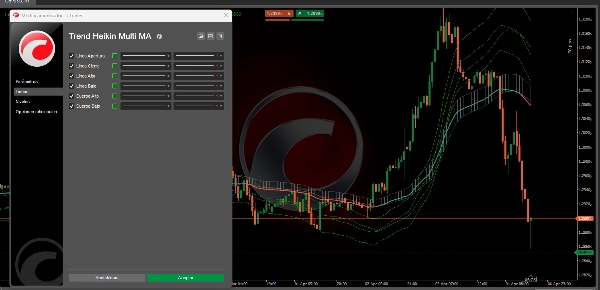
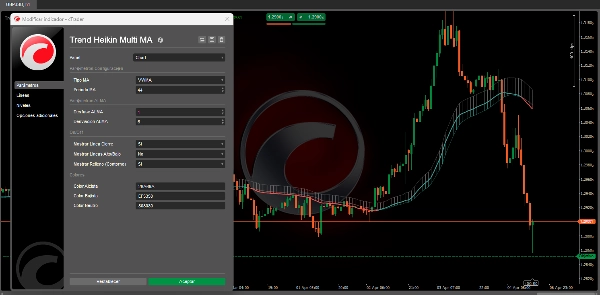
- 🔄 Auswahl des gleitenden Durchschnitts:
-
- Der Benutzer kann zwischen verschiedenen Arten von gleitenden Durchschnitten wählen (ALMA, HMA, SMA, SWMA, VWMA, WMA, ZLEMA und EMA).
- Jeder MA-Typ wendet eine spezifische mathematische Methode an, um die historischen Werte von Open, Close, High und Low, die aus Heikin-Ashi abgeleitet sind, zu gewichten und zu glätten.
🏆 3. Vorteile der Verwendung von TrendHeikinMultiMA gegenüber traditionellen Kerzencharts
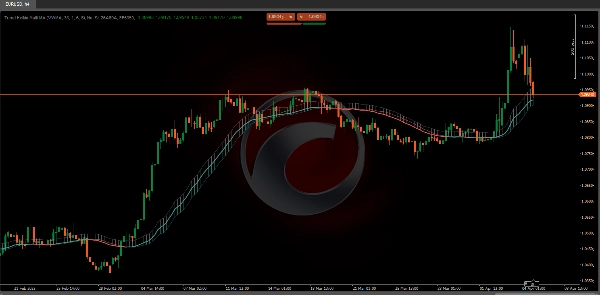
- 📉 Rauschunterdrückung:
-
- Traditionelle Kerzencharts zeigen oft hohe Volatilität und verstreute Daten, was es erschwert, den Gesamtrend zu erkennen.
- TrendHeikinMultiMA glättet diese Daten, filtert kleinere Schwankungen heraus und eliminiert abrupte Ausschläge, so dass sich Trader auf die primäre Marktrichtung konzentrieren können.
✅ Fazit
Zusammenfassend bestätigt TrendHeikinMultiMA eine Trendänderung (bullisch oder bärisch) nur dann, wenn die geglätteten Open- und Close-Werte—berechnet aus Heikin-Ashi und verarbeitet durch den ausgewählten gleitenden Durchschnitt—konsequent zeigen, dass sich das Marktverhalten in seiner Richtung umgekehrt hat.
Dies stellt sicher, dass Signale zuverlässiger sind und weniger durch das Rauschen beeinflusst werden, das in traditionellen Kerzencharts zu sehen ist. 🚀📊
🔥 Pinescritlabs Ctrader Store Indikatoren 🔥
Dynamic Market Structure
Analysis of Turning Points
Fibonacci Linear
Regression Multi-timeframe
Multi-Level Candle Bias
Tracker
Auto Support and
Resistance Trend Lines
All Support and
Resistance Levels
Zusammenfassung
The indicator incorporates a smoothing mechanism that delays color changes to confirm trend reversals only after a significant and sustained difference between smoothed open and close values is detected. This approach reduces false signals caused by brief price fluctuations crossing trend lines.
Users can select from multiple moving average types, each applying distinct mathematical weighting methods to the Heikin-Ashi-derived open, close, high, and low values, enhancing customization and adaptability to different trading styles.
Compared to traditional candlestick charts, Trend Heikin Multi MA filters out minor price fluctuations and abrupt swings, allowing traders to focus on primary market trends with more reliable signals. It confirms bullish or bearish trend changes only when smoothed values consistently indicate a market direction reversal, improving signal accuracy and reducing noise.
Kundenbewertungen
5 | 33 % | |
4 | 67 % | |
3 | 0 % | |
2 | 0 % | |
1 | 0 % |


