Описание
SmartTrendScanner
Обзор
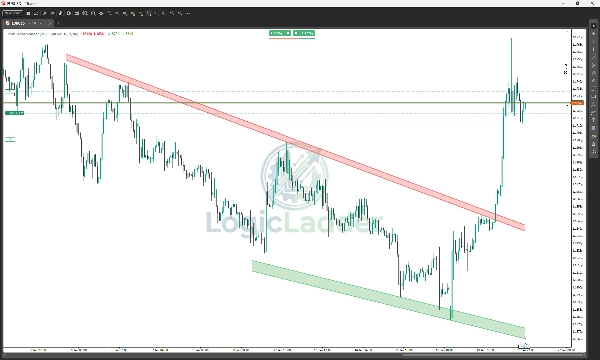
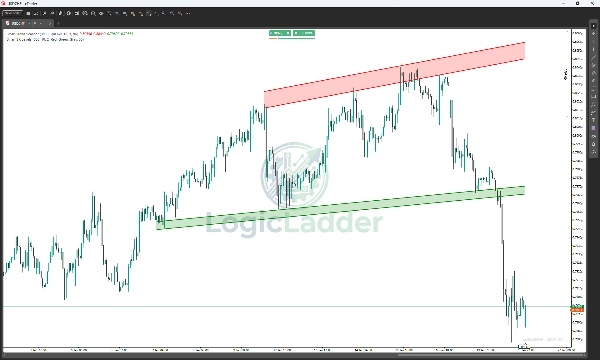
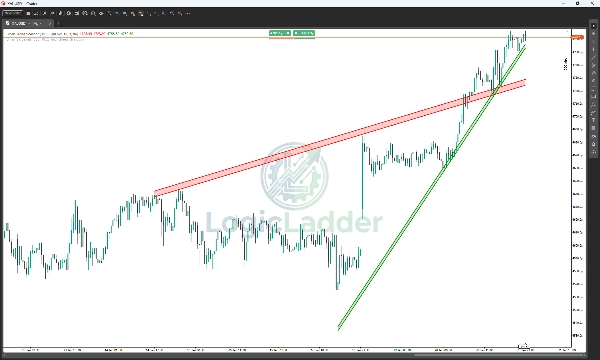
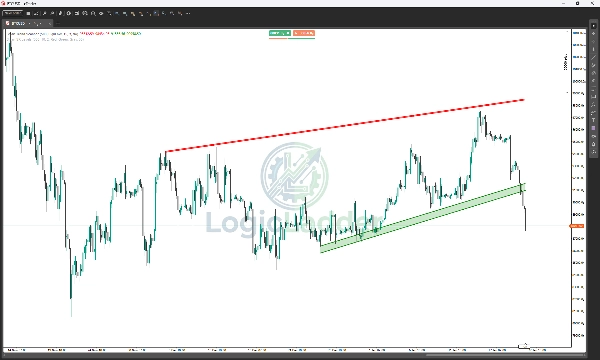
SmartTrendScanner — это профессиональный индикатор для cTrader, разработанный для автоматизации субъективного искусства анализа трендов. В отличие от традиционных индикаторов, которые рисуют тонкие трендовые линии по одной цене, SmartTrendScanner выявляет и визуализирует динамические зоны облаков спроса и предложения.
Работая на основе алгоритма "Лучшего соответствия", он сканирует исторические ценовые движения, чтобы найти наиболее математически значимые точки соединения, рисуя заполненные каналы, которые представляют истинную область поддержки и сопротивления.
Ключевые особенности
- Динамические облачные зоны: Заменяет тонкие линии заполненными "облачными" каналами, визуально покрывающими весь диапазон касаний цены (тени и тела свечей), чтобы предотвратить ложные пробои.
- Интеллектуальное обнаружение пивотов: Автоматически определяет ключевые Swing High и Swing Low на основе ваших пользовательских настроек чувствительности.
- Алгоритм лучшего соответствия: Индикатор создает тысячи потенциальных трендовых линий в фоновом режиме и фильтрует их, отображая только самые сильные, наиболее уважаемые зоны, ближайшие к текущей цене.
- Фильтры стабильности: Встроенная логика проверяет сломанные структуры, гарантируя, что вы не торгуете по недействительным или устаревшим уровням.
- Оповещения в реальном времени: Никогда не пропускайте движение. Получайте мгновенные всплывающие и звуковые уведомления, когда цена выходит из зоны или повторно тестирует уровень.
- Полная настройка: Настраивайте прозрачность облака, цвета, силу пивота и историю просмотра, чтобы соответствовать вашему стилю торговли (скальпинг, дневная торговля или свинг).
Как это работает
- Сканирует историю: Индикатор просматривает заданное пользователем количество баров (например, 300 баров) для поиска фрактальных пивотных точек.
- Соединяет точки: Он проверяет соединения между пивотами, чтобы найти допустимые наклоны тренда.
- Проверяет зону: Он проверяет, касалась ли цена проецируемой линии достаточно раз (Мин. касаний) без значительных пробоев в недавнем прошлом.
- Рисует облако: Как только найден допустимый тренд, он рисует прозрачное облако между самым высоким касанием тени и самым низким касанием тела, создавая "зону действия".
Руководство по настройкам
- Количество баров для применения: Насколько далеко назад по истории сканер смотрит (по умолчанию: 300). Увеличьте это для долгосрочной свинг-торговли.
- Сила пивота: Чувствительность обнаружения фракталов. Более высокие значения (например, 15+) находят основные структурные точки; более низкие значения (например, 5) находят мелкую внутреннюю структуру.
- Мин. подтверждение пивота: Минимальное количество касаний цены зоны, чтобы считать её действительной.
- Прозрачность зоны: Управляет непрозрачностью цвета заливки (0 = невидимо, 255 = сплошной).
Почему LogicLadder?
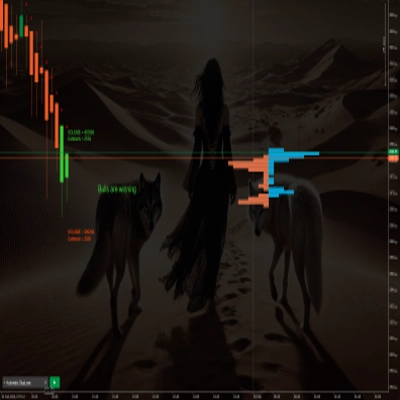
Торговля — это вероятность, а не уверенность. Визуализируя поддержку и сопротивление как зоны вместо тонких линий, SmartTrendScanner помогает вам видеть, где скрывается реальная ликвидность, позволяя опережать толпу.
Сводка
Key features include dynamic cloud zones that cover the full price range to reduce false signals, intelligent pivot detection adjustable by sensitivity, stability filters to avoid outdated levels, and real-time alerts for breakouts or retests. Users can customize settings such as lookback period, pivot strength, minimum touches for zone validation, and cloud transparency to suit various trading styles including scalping, day trading, and swing trading.
Smart Trend Scanner supports multiple markets including Forex, commodities, stocks, and cryptocurrencies, with symbol tags like BTCUSD, EURUSD, GBPUSD, XAUUSD, and NAS100. It aims to provide clearer visualization of liquidity zones to assist traders in making informed decisions based on probabilistic support and resistance areas.