
🚀 Более 10 000 трейдеров уже используют наши ТОП индикаторы 🏆 …и сообщество продолжает расти!
Узнайте, почему профессионалы выбирают нас – самые мощные инструменты cTrader (индикаторы + алгоритмы + cBots) ждут вас.
👉 Получите все наши ТОП-системы здесь:
Индикаторы Pinescriptlabs Store: cBots Pinescriptlabs Store : (cBot) Gold & BTC BreakoutSession Pivots(новинка)
Advanced Market Structure: Bos, Choch, SwinLevels, Order Blocks, Market Structure & Liquidity Finder (Новинка)
ZigZag Price Liquidity Projection
Trailing Smart Algorithm (новинка)
Карта ликвидации с кредитным плечом
Прогноз на основе Linreg & ATR
SmartTrend Поддержка и
Сопротивление
Линии
Сессии разрыва справедливой стоимости
Динамический
Анализ структуры рынка
поворотных
точек
Points
Фибоначчи
Линейная
Регрессия
Мультивременной
Многоуровневый
Трекер свечного смещения
Tracker
Авто
Линии поддержки и
сопротивления
тренда
Lines
Все
уровни поддержки и
сопротивления
Levels
Динамический диапазон моментума
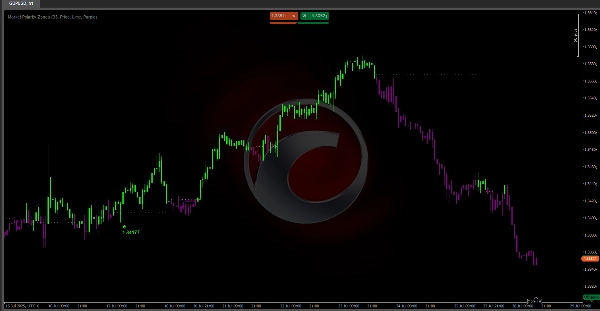
Зоны рыночной полярности 📊
Что делает этот алгоритм?
Зоны рыночной полярности — это продвинутый индикатор, который упрощает анализ рынка, автоматически определяя бычьи 🚀 или медвежьи 🐻 фазы и отмечая ключевые уровни, где вероятны развороты тренда.
Идеально подходит для:
- Трейдеров, работающих с ценовым действием
- Свинг-трейдеров
- Скальперов,... которым нужно быстро определить направление рынка и точные точки входа/выхода.
Как работает логика?
Алгоритм использует две скользящие средние Халла (HMA) с разными периодами для обнаружения смены импульса и устанавливает динамические уровни следующим образом:
- Обнаруживает пересечения HMA для определения изменений тренда.
- Устанавливает автоматические уровни:
-
- Бычье пересечение → Отмечает минимум как уровень поддержки
- Медвежье пересечение → Отмечает максимум как уровень сопротивления
- Сохраняет активный уровень до появления нового пересечения.
Что вы увидите на своем графике:
🎨 Интуитивная цветовая система:
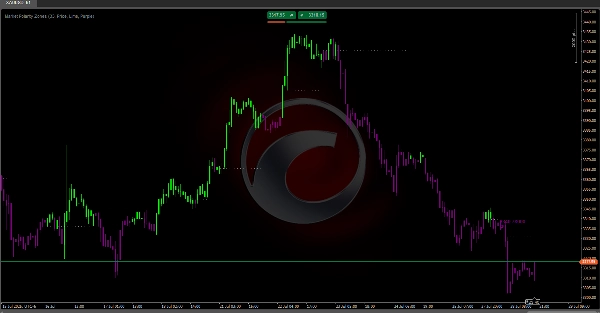
- Зеленые свечи 🟢: Цена выше уровня (бычья зона – ищите покупки)
- Фиолетовые свечи 🟣: Цена ниже уровня (медвежья зона – ищите продажи)
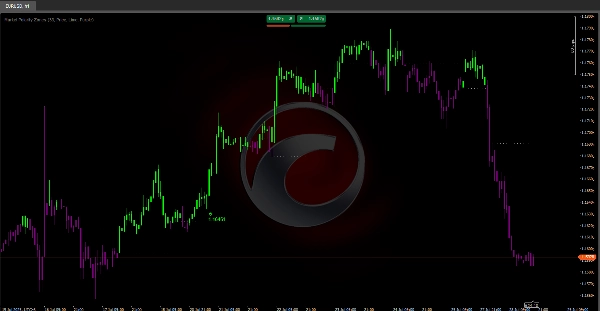
📉 Динамические линии уровней:
- Пунктирные горизонтальные линии отмечают активный уровень полярности
- Автоматически продолжаются пока уровень остается актуальным
- Появляются только когда уровень стабилизируется
⚠️ Оповещения о разворотах:
Появляются стрелочные метки при формировании определенных паттернов:
- 🔻 Медвежий разворот (фиолетовая метка):
-
- Паттерн: Цена растет → неудача → падает ниже уровня
- Значение: Ослабление бычьего давления, возможный переход в медвежью зону
- 🔺 Бычий разворот (зеленая метка):
-
- Паттерн: Цена падает → отскакивает → поднимается выше уровня
- Значение: Покупатели защищают уровень, возможный переход в бычью зону
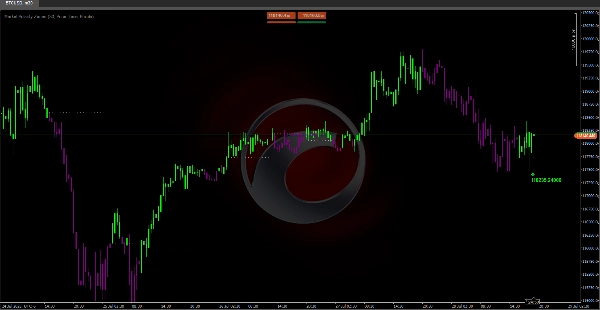
ℹ️ Информация о метках:
- "Цена": Показывает точную точку неудачного пробоя – используйте для точных стопов или определения ключевого сопротивления/поддержки.
- "Объем": Сумма объема последних 3 баров – подтверждает, есть ли у разворота реальное участие рынка.
Рекомендуемые настройки:
- Длина: 33 (по умолчанию) – хорошо работает для большинства рынков
- Данные меток: "Цена" для точности уровня, "Объем" для подтверждения
- Цвета: Сохраняйте Lime/Purple для лучшего визуального контраста 🎨


![Логотип продукта "[Hamster-Coder] Moving Average MTF"](https://cdn.ctrader.com/image/webp/b11b98b1-194d-4b8e-b00e-d611826ad159_31226)


