说明
概述
瞬时趋势线是由约翰·埃勒斯(John Ehlers)开发的一种技术指标,他是一位电气工程师,将数字信号处理(DSP)原理应用于金融市场分析。该指标最初发表于《Stocks & Commodities》杂志(2002年2月),并在他的著作《Rocket Science for Traders》和《Cybernetic Analysis for Stocks and Futures》中详细介绍。该指标通过滤除周期性(振荡)成分,隔离价格数据的趋势成分。
概念
与仅仅平滑价格数据的传统移动平均线不同,瞬时趋势线使用源自电气工程的数学技术,将价格行为分解为两个不同的成分:
- 趋势成分 - 市场的方向性偏好
- 周期成分 - 围绕趋势的振荡波动
通过应用陷波滤波器和希尔伯特变换方法,埃勒斯创建了一个能够快速响应真实趋势变化,同时滤除噪声和短期周期的指标。结果是一个相较于相似周期的简单或指数移动平均线具有显著减少滞后的趋势线,能够适应市场状况。
这种方法的核心优势在于数学上的精确性,将“趋势”与“周期噪声”分离,而不仅仅是在固定回溯期内对价格进行平均。
工作原理
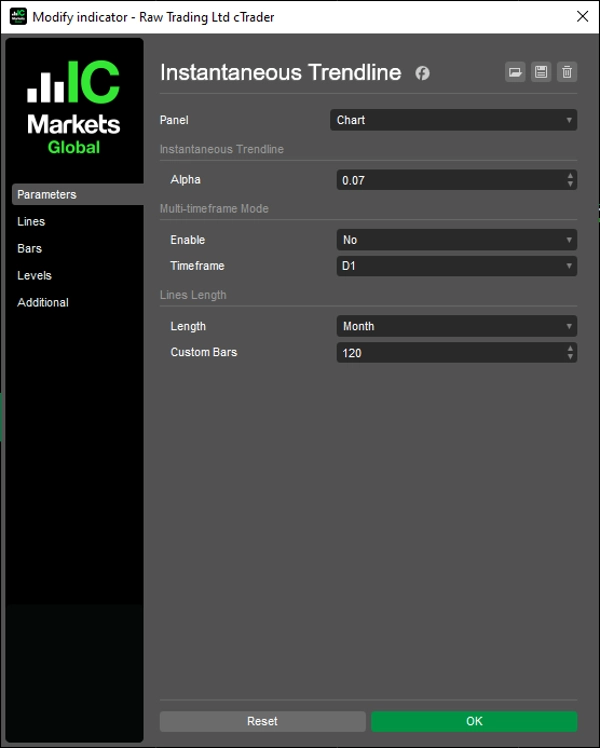
该指标使用基于Alpha参数的递归公式计算平滑趋势线。该公式包含:
- 当前及近期价格数据(高低价中点 HL/2)
- 先前的趋势线数值
- Alpha平滑系数(默认 0.07)
该指标还生成一个触发线,即将瞬时趋势线向前移动2个周期。该触发线用于通过交叉逻辑生成交易信号。
解释
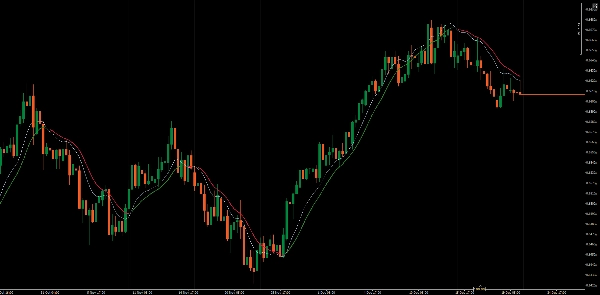
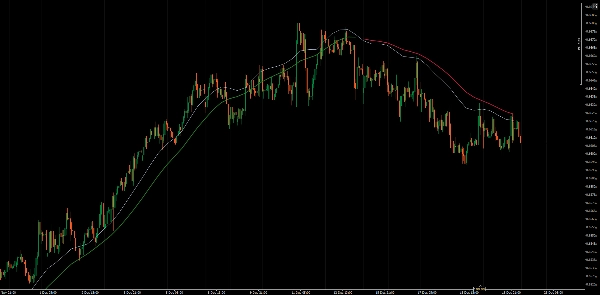
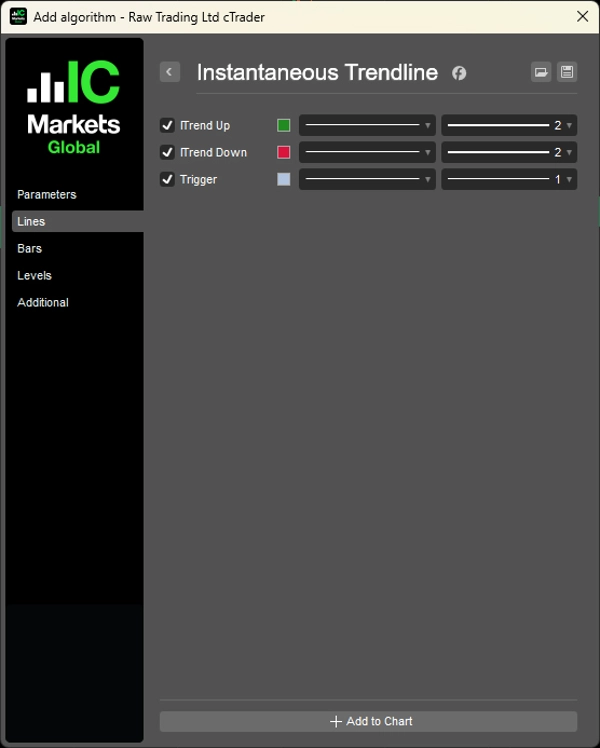
该指标绘制三条线:
- ITrend 上升: 当触发线 > ITrend时显示,表示看涨状态
- ITrend 下降: 当触发线 < ITrend时显示,表示看跌状态
- 触发线: 趋势线延迟2个周期的版本
信号生成:
- 看涨信号: 当触发线向上穿越瞬时趋势线时
- 看跌信号: 当触发线向下穿越瞬时趋势线时
颜色编码的显示使得一目了然地识别当前趋势方向变得容易。
关键参数
Alpha (0.01 - 1.0,默认 0.07)
控制趋势线的平滑度和响应速度。较低的值产生更平滑、响应较慢的趋势线,适合长期趋势。较高的值提高对价格变化的敏感度,但可能在震荡市场中产生更多误信号。默认值 0.07 在响应速度和噪声过滤之间取得平衡。
线条长度(默认120)
决定图表上显示的历史趋势线数据的周期数。这有助于保持图表整洁,同时保留足够的上下文。
局限性
- 像所有趋势跟踪工具一样,瞬时趋势线在震荡、横盘市场中可能产生鞭打(误信号)
- 在强趋势期间,指标可能让你更长时间保持在趋势中,但可能错过确切的顶部或底部
- 性能因市场状况(趋势与震荡)而显著不同
- 该指标是反应性的,而非预测性的——它在趋势开始后识别趋势
__________________________________________________________________________________________
更多免费指标
探索各种市场分析工具——从结构和成交量到回归、波动率和自定义时间框架。
源代码可在GitHub 仓库中获取。
全部免费使用。但如果您愿意支持咖啡费用,可以通过 这里进行捐赠。
支撑/阻力
成交量
移动平均线
实用工具/自定义
基于回归
波动率
振荡器
__________________________________________________________________________________________
免责声明
交易涉及风险。该指标仅用于技术分析——请始终应用适当的风险管理并负责任地交易。
反馈与改进
如果您有建议、功能请求或改进想法,请在讨论标签中留言。您的反馈有助于为所有人改进该指标。
摘要
客户评价
5 | 100 % | |
4 | 0 % | |
3 | 0 % | |
2 | 0 % | |
1 | 0 % |