

说明
参与交易的人都知道考虑前一交易时段的重要性。
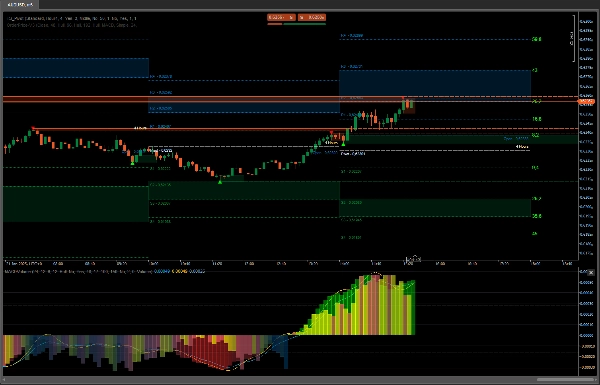
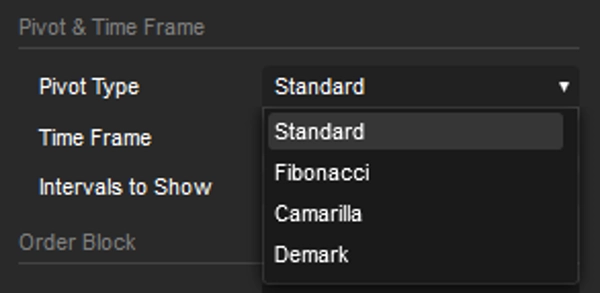
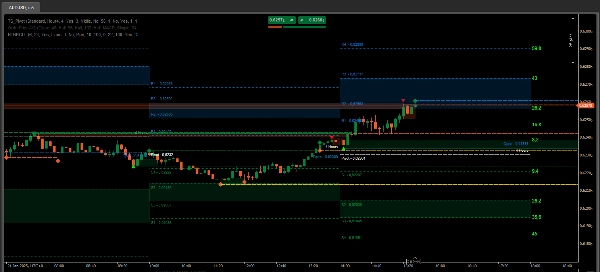
我准备了这个枢轴指标,时间间隔从15分钟到一个月不等,包含订单区块和趋势线。两者都是基于前一交易时段的最高点和最低点。
默认配置设定为5分钟时间框架。
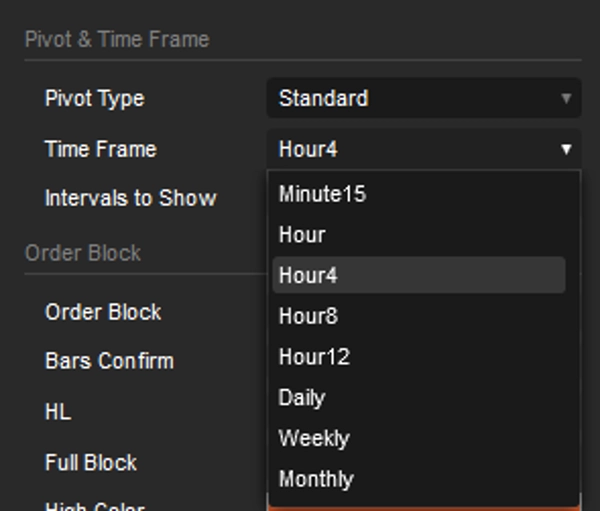
枢轴设为4小时,间隔为5,这意味着它以4小时为间隔回溯20小时。这对于日内交易者来说非常合适。
然而,如果你是摆动交易的爱好者,只需更改枢轴间隔;其他一切都会自动调整。
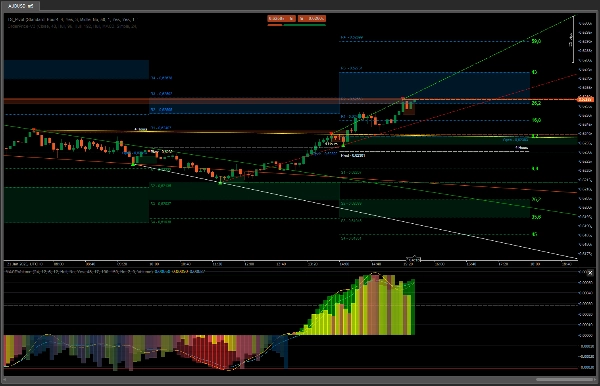
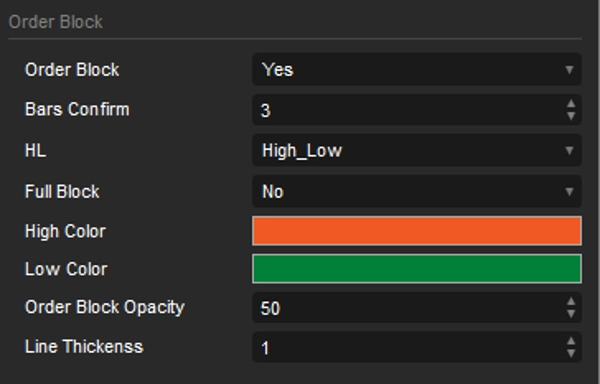
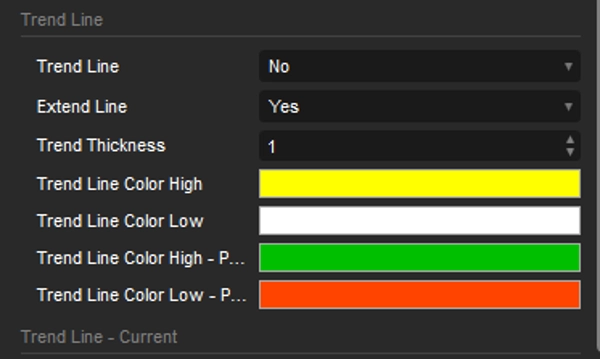
订单区块突出显示价格可能找到支撑或阻力的潜在区域,提供可能的反转或延续的洞察。通过将它们与所选时间框架自动生成的趋势线结合,交易者可以更准确地识别潜在的价格方向以及可能的进出点。跨多个时间框架可视化这些趋势线的能力提供了对市场结构更完整的理解。
配合以下附加工具
OrderPrice V3 https://ctrader.com/products/397
NTMPICLL https://ctrader.com/products/327
Range Box Level https://ctrader.com/products/245
Or RangeBoxFibonacci https://ctrader.com/products/526
Market Session https://ctrader.com/products/94
MacdVolume https://ctrader.com/products/267
4MA https://ctrader.com/products/247
你将无敌
祝你好运 😀
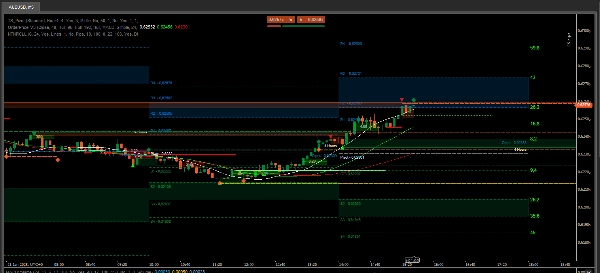
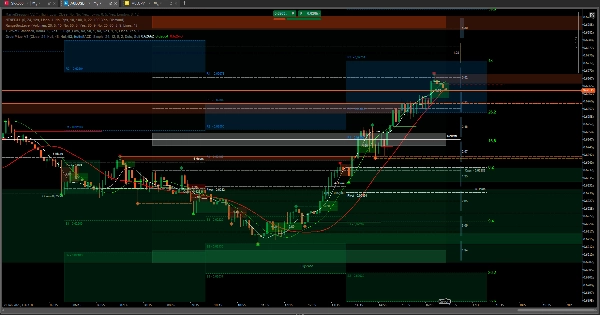
在买入的情况下,观察最后两张图片中OrderPrice和内置移动平均线的表现,当出现绿色线且移动平均线在其下方时,是开仓买入的最佳时机。
通过前一交易时段的数据,你可以判断价格可能达到的距离或阻力位置。如果突破,可能会继续到第二个点,这可能是RangeBoxLevel的中性区。如果超过该点且没有迹象表明移动平均线想要改变方向,价格可能达到前一交易时段的订单区块区域。
在最后一张图片中,有一个完美的进出交易的截图。剩下的就是观察和得出结论。
这些工具在资产交易中取胜时至关重要。
摘要
Key features include the integration of order blocks and trend lines derived from previous session data. Order blocks identify potential support and resistance zones, aiding in spotting possible price reversals or continuations. The indicator automatically generates trend lines for the selected timeframe, helping traders assess market structure and potential price direction. Visualizing these trend lines across multiple timeframes enhances market analysis.
TS_Pivot can be used alongside complementary tools such as OrderPrice V3, NTMPICLL, Range Box Level, RangeBoxFibonacci, Market Session, MacdVolume, and 4MA to refine entry and exit decisions. By combining moving averages and order block signals, traders can identify optimal moments to open buy or sell positions. The indicator supports various markets including Forex, cryptocurrencies, commodities, indices, and stocks.
客户评价
5 | 100 % | |
4 | 0 % | |
3 | 0 % | |
2 | 0 % | |
1 | 0 % |


!["[Hamster-Coder] Moving Average MTF" 标识](https://cdn.ctrader.com/image/webp/b11b98b1-194d-4b8e-b00e-d611826ad159_31226)


