
说明
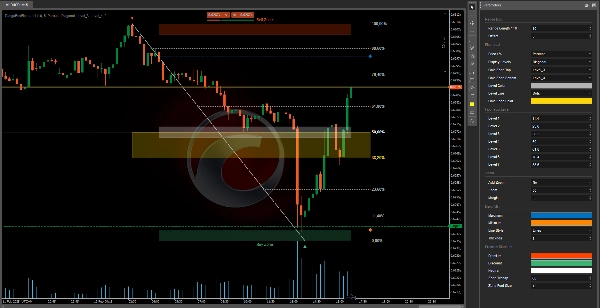
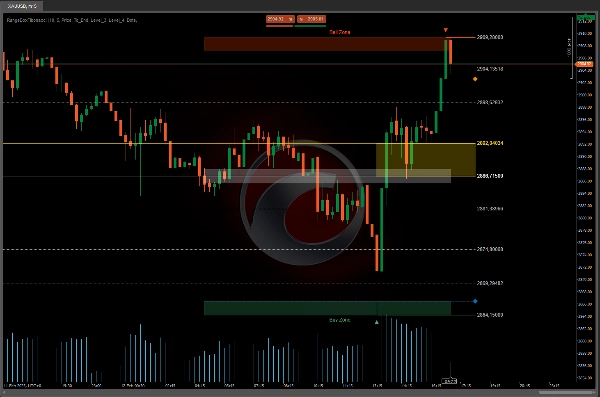
这个斐波那契回撤指标允许交易者可视化并自定义关键回撤水平,以识别市场中的潜在买入和卖出区域。
除了彩色的“卖出区”和“买入区”之外,用户还可以根据自己的喜好调整斐波那契水平。
该指标配有一个独立的警报指标,以提供更完整的交易体验。
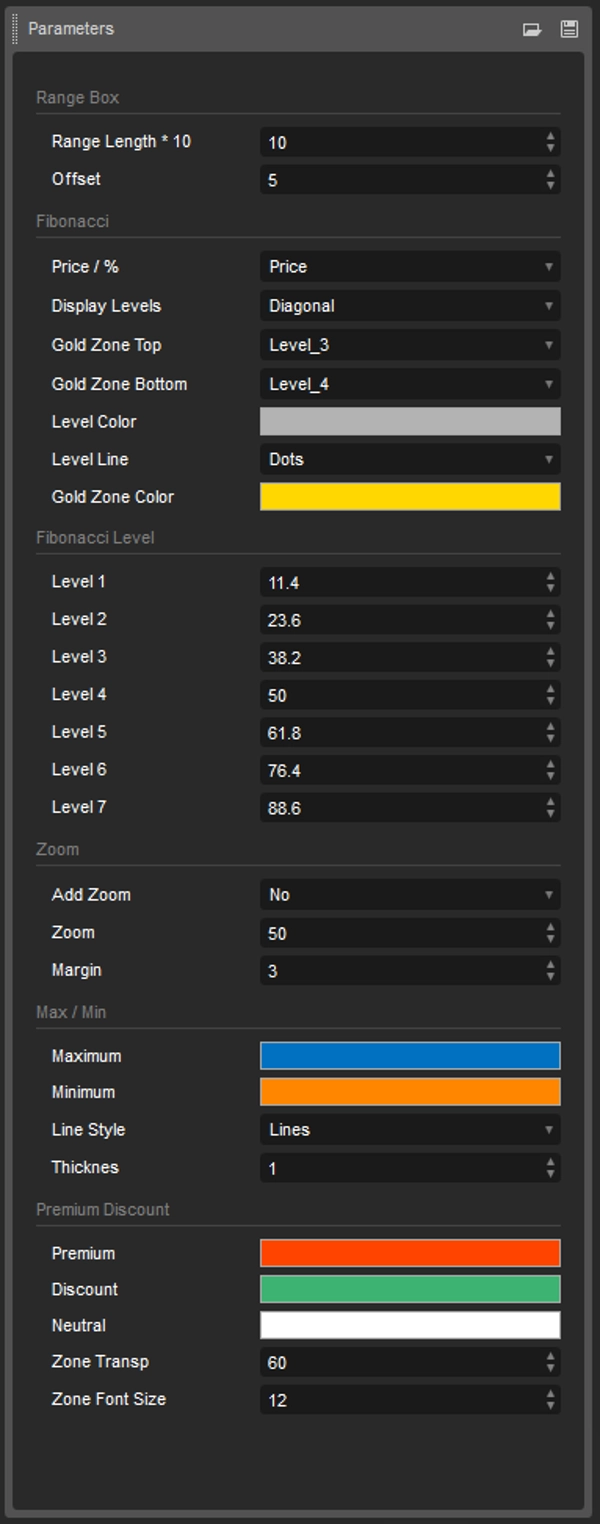
使用这个斐波那契回撤指标,交易者可以完全控制图表上显示的回撤水平。
自定义斐波那契水平的能力,加上彩色区域和独立的警报指标,使用户能够根据个人交易策略定制该工具。
如果您包含以下工具:
- OrderPrice V3 https://ctrader.com/products/397
- NTMPICLL https://ctrader.com/products/327
- MACDVolume https://ctrader.com/products/267
- MarketSession-MX https://ctrader.com/products/525
就没有办法亏很多钱。
摘要
AI 摘要
RangeBoxFibonacci is a customizable Fibonacci retracement indicator designed for traders to identify potential buy and sell zones across various markets including Forex, commodities, and indices such as EURUSD, GBPUSD, NZDUSD, XAUUSD (gold), and NAS100. The indicator displays key Fibonacci retracement levels on the chart, which users can adjust to fit their trading strategies. It highlights colored zones labeled "Sell Zone" and "Buy Zone" to visually assist in market analysis. Additionally, it is complemented by a separate alerts indicator to notify users of relevant market conditions. The tool supports integration with other trading aids like OrderPrice V3, NTMPICLL, MACDVolume, and MarketSession-MX, enhancing its functionality. This indicator provides traders with full control over displayed retracement levels, enabling tailored technical analysis for improved decision-making.
指标配置
客户评价
4.5
评价:2
5 | 50 % | |
4 | 50 % | |
3 | 0 % | |
2 | 0 % | |
1 | 0 % |
客户评价
August 18, 2025
Displays Fibonacci zones in structured 9-level ranges. Lightweight and visually intuitive. Works on all timeframes. Cons: No alerts, tooltips, or preset saving. Needs confirmation tools to reduce subjectivity.
February 25, 2025
tested small first and that felt like the right move, and Bad settings can ruin the idea.
讨论
常见问答
Forex
EURUSD
Commodities
GBPUSD
NZDUSD
XAUUSD
NAS100
cTrader Store 提供的所有产品,包括交易机器人、指标和插件,均由第三方开发者提供,仅供信息参考和技术访问之用。cTrader Store 并非经纪商,不提供投资建议、个人推荐或任何未来业绩保证。


!["Wyckoff Toolkit [Iridio Capital]" 标识](https://cdn.ctrader.com/image/webp/8acfe6a1-6a8e-4578-9367-9df3af2b1801_27763)


价格
147
销售
11.2K
免费安装