
Professional-grade Anchored VWAP
指标
3 购买
版本 1.0, Nov 2025
Windows 版、Mac 版
4.5
评价:2
说明
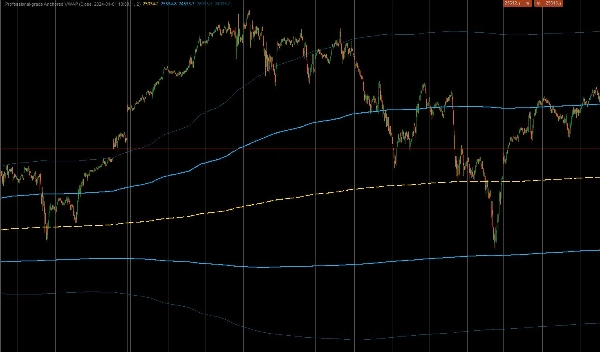
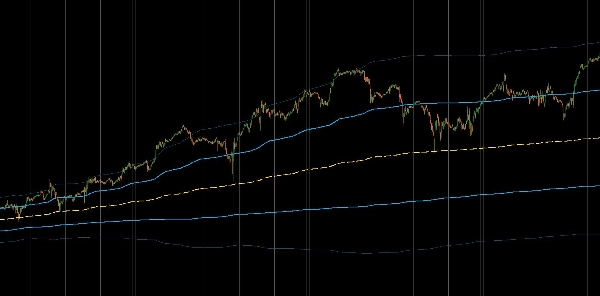
这是一个为cTrader设计的专业级自定义指标,用于计算锚定成交量加权平均价(AVWAP)。与每日重置的标准VWAP指标不同,该工具允许交易者将计算“锚定”到特定的高影响事件——例如CPI发布、市场崩盘或趋势开始——从而提供自该时刻以来的真实机构视角的平均价格。它还包括成交量加权标准差带,用于识别过度延伸的价格行为。
1. 核心计算与锚定逻辑
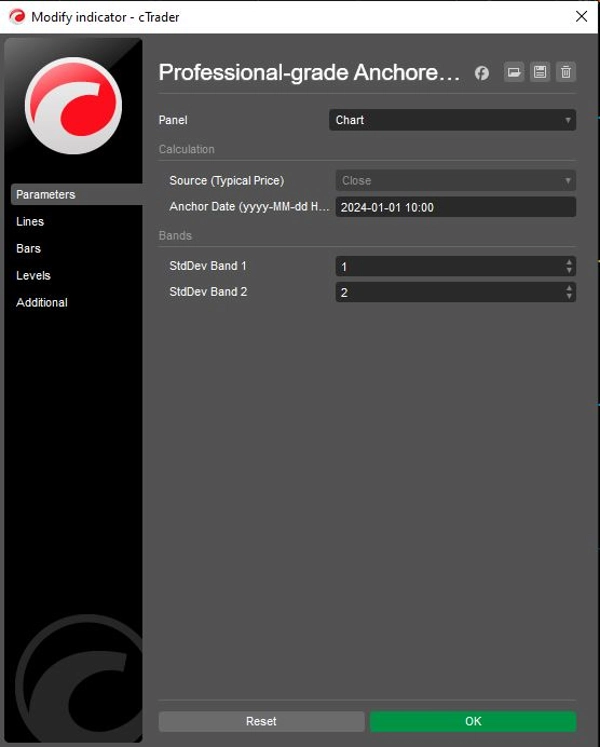
- 精确锚定: 指标利用用户定义的
Anchor Date(例如,“2024-01-01 10:00”)严格忽略该特定分钟之前的所有数据。这确保平均价格仅反映当前特定走势或时间框架内的参与者。 - 机构公式: 它使用(价格 × 成交量)的累积和除以成交量的累积和来计算真实的VWAP。
- 典型价格来源: 默认使用“典型价格”
(High + Low + Close) / 3进行计算,这是机构算法用于确定公允价值的标准方法,尽管也可以调整为开盘价或收盘价。
2. 高级波动率带
为了帮助交易者判断市场极端情况,指标计算了基于成交量加权方差的两组动态带:
- 带1(价值区): 默认设置为1.0标准差。该内区通常包含市场的“公允价值”噪音。从该区突破通常预示动能。
- 带2(极端区): 默认设置为2.0标准差。价格达到该外带时,统计上被认为过度延伸,通常预示潜在的均值回归机会(逆势操作)或强趋势耗竭。
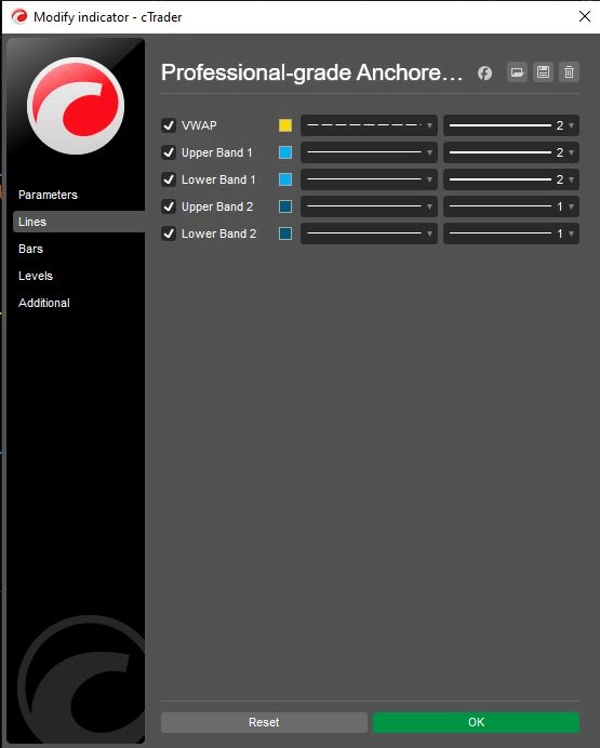
- 独立控制: 两个带均包含单独的
Show切换(ShowBand1,ShowBand2)和可自定义的偏差倍数(Band1Dev,Band2Dev),允许根据特定波动率策略定制清晰的图表。
3. 视觉与操作逻辑
- 战略性色彩编码:
-
- 黄色(VWAP): 作为中心“磁铁”或趋势基线。
- 青柠绿(带1): 代表即时支撑/阻力“价值区”。
- 红色(带2): 突出显示极端偏差,增加反转概率。
- 状态保存: 代码使用
IndicatorDataSeries作为内部状态变量(_cumVol,_cumPV),确保在历史重算和实时更新过程中数值保持准确,无重绘错误。
逻辑流程总结
- 初始化: 将用户指定的Anchor Date字符串解析为系统DateTime对象。
- 时间过滤: 对每个K线,检查当前时间是否早于锚点。如果是,则返回
NaN(不绘制)并将累计计数器重置为零。 - 数据累积: 一旦达到锚点时间,开始将当前K线的成交量和(价格 × 成交量)加入累计总和。
- 计算VWAP: 用累计的PV总和除以累计成交量总和,得到VWAP线。
- 计算方差: 计算成交量加权方差并推导标准差。
- 绘制波段: 在VWAP线上加减计算出的偏差,绘制青柠绿和红色波段。
摘要
AI 摘要
This professional-grade custom indicator for cTrader calculates the Anchored Volume Weighted Average Price (AVWAP) and volume-weighted standard deviation bands from a user-defined start date. Unlike standard VWAP indicators that reset daily, it anchors the VWAP calculation to a specific event or time, such as a market release or trend start, providing an institutional perspective on average price since that anchor point.
Key features include:
- Precision anchoring to a user-specified date and time, ignoring data before that moment.
- Institutional VWAP calculation using cumulative (Price × Volume) divided by cumulative Volume.
- Default use of Typical Price ((High + Low + Close) / 3) for fair value, adjustable to Open or Close prices.
- Two dynamic volatility bands based on volume-weighted variance: Band 1 (1 standard deviation) representing the value zone, and Band 2 (2 standard deviations) indicating extreme price deviations.
- Independent toggles and customizable deviation multipliers for each band.
- Strategic color coding: yellow for VWAP, lime green for Band 1, and red for Band 2.
- Internal state preservation ensures accurate values during historical and real-time updates without repainting.
The indicator supports markets including Forex, indices, commodities, stocks, and cryptocurrencies, and is suitable for various symbols such as BTCUSD, EURUSD, GBPUSD, XAUUSD, and NAS100.
指标配置
客户评价
4.5
评价:2
5 | 50 % | |
4 | 50 % | |
3 | 0 % | |
2 | 0 % | |
1 | 0 % |
讨论
常见问答
BTCUSD
Forex
Breakout
Indices
EURUSD
Commodities
GBPUSD
NZDUSD
Bollinger
Fibonacci
Scalping
SMC
Crypto
Stocks
XAUUSD
NAS100
USDJPY
VWAP
cTrader Store 提供的所有产品,包括交易机器人、指标和插件,均由第三方开发者提供,仅供信息参考和技术访问之用。cTrader Store 并非经纪商,不提供投资建议、个人推荐或任何未来业绩保证。
该作者的其他作品


价格
注册日期 26/09/2025
16
销售