
SpreadGuard Cost Spread Overlay
指标
版本 1.0, Jan 2026
Windows 版、Mac 版
4.0
评价:1
说明
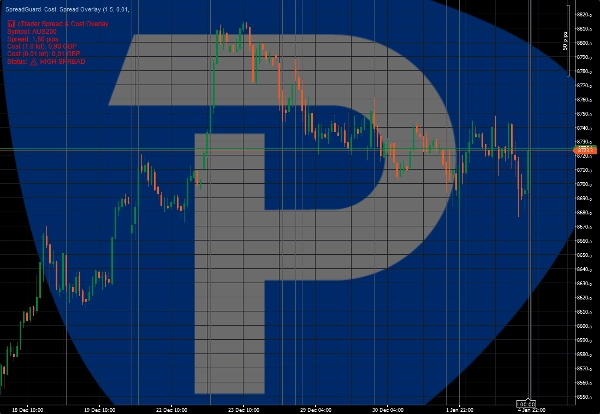
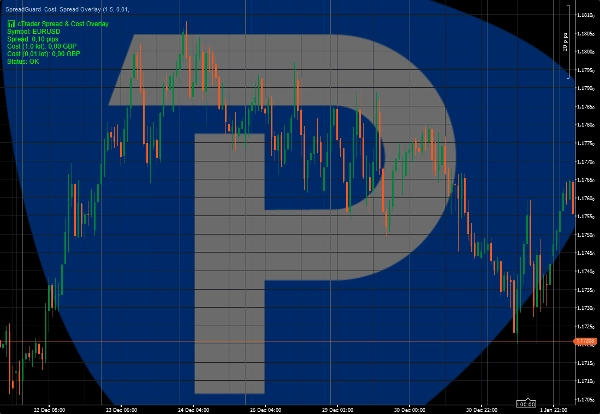
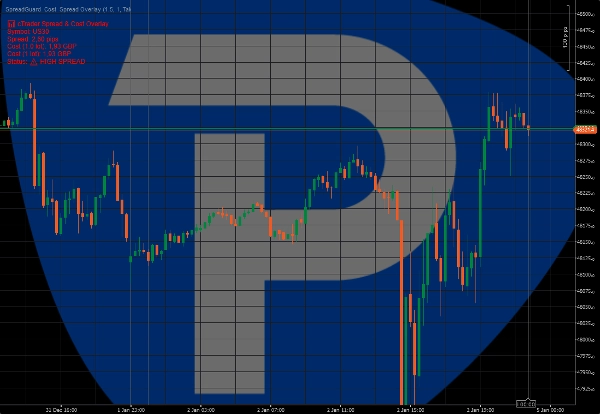
cTrader 点差和成本叠加 是一个轻量级指标,旨在直接在图表上可视化实时交易成本。
该指标显示当前的点差(以点为单位),并根据所选手数计算交易的估计成本。视觉警告突出显示高点差时期,帮助交易者避免不利的执行条件。
主要特点:
• 实时点差显示(点)
• 所选手数的估计交易成本
• 当点差超过设定阈值时的视觉警告
• 干净的图表叠加层
该指标不进行交易或生成交易信号。
它旨在作为手动交易者的执行和风险意识工具。
适合剥头皮交易者、日内交易者和自营交易账户。
*早期访问价格。未来更新可能以更高的常规价格发布。
摘要
指标配置
客户评价
4.0
评价:1
5 | 0 % | |
4 | 100 % | |
3 | 0 % | |
2 | 0 % | |
1 | 0 % |
客户评价
January 16, 2026
Tbh it is not magic, just a decent extra filter. It should not be treated as the full answer.
讨论
常见问答
Prop
Forex
EURUSD
GBPUSD
ATR
cTrader Store 提供的所有产品,包括交易机器人、指标和插件,均由第三方开发者提供,仅供信息参考和技术访问之用。cTrader Store 并非经纪商,不提供投资建议、个人推荐或任何未来业绩保证。
该作者的其他作品


价格
注册日期 02/01/2026
2
销售