
CCI - With Arrows and 40 80 EMA Logic_noSourceCode
指标
2 购买
版本 1.0, Feb 2025
Windows 版、Mac 版
5.0
评价:1
说明
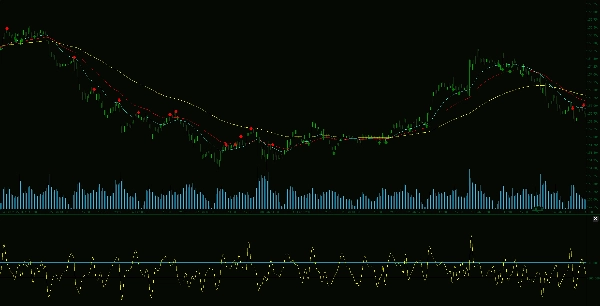
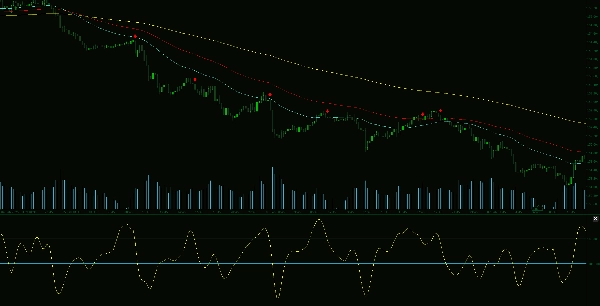
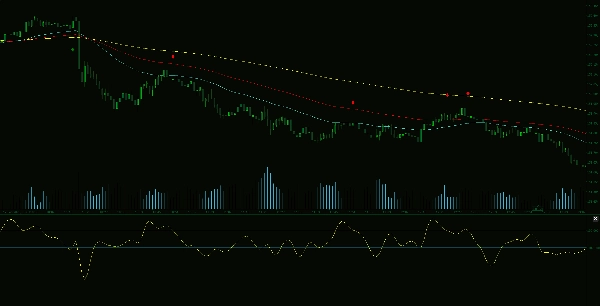
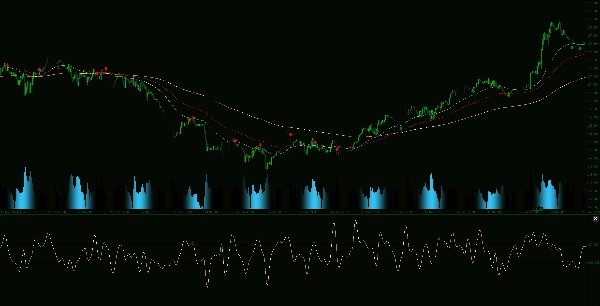
高级CCI和EMA指标是一种强大的交易工具,通过结合商品通道指数(CCI)与40和80 EMA逻辑,增强了趋势分析。这种复杂的方法生成箭头,指示潜在的价格走势,帮助交易者识别高概率的交易机会。
主要特点:
摘要
指标配置
客户评价
5.0
评价:1
5 | 100 % | |
4 | 0 % | |
3 | 0 % | |
2 | 0 % | |
1 | 0 % |
客户评价
February 25, 2025
half size is enough at the start. Low quality setups lose some appeal.
讨论
常见问答
Indices
Commodities
cTrader Store 提供的所有产品,包括交易机器人、指标和插件,均由第三方开发者提供,仅供信息参考和技术访问之用。cTrader Store 并非经纪商,不提供投资建议、个人推荐或任何未来业绩保证。
该作者的其他作品


价格
注册日期 14/01/2025
55
销售
11.27K
免费安装