
Supply Demand - BasicV1
Indikator
1.27K downloads
Version 1.0, Feb 2025
Windows, Mac
5.0
Bewertungen: 3
Beschreibung
Identifizieren Sie Handelszonen mit hoher Wahrscheinlichkeit präzise
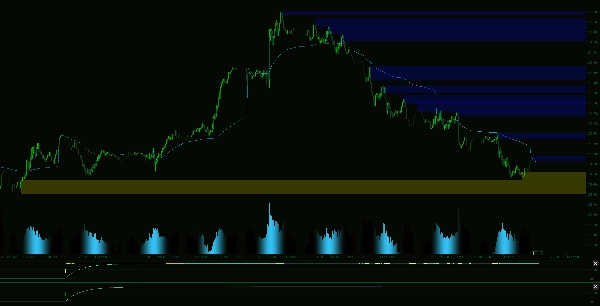
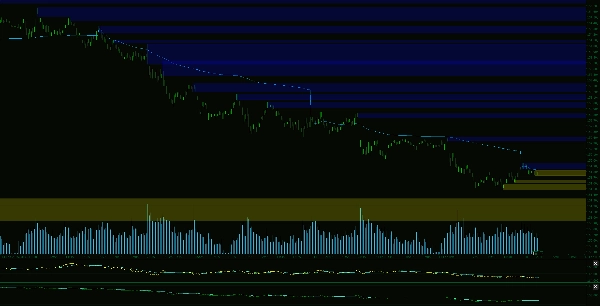
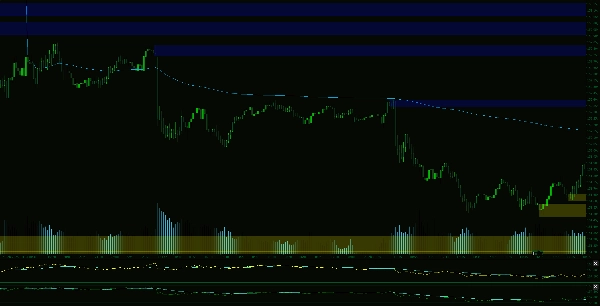
Müde, Angebots- und Nachfragezonen manuell zu zeichnen? Dieser fortschrittliche Indikator übernimmt die gesamte Arbeit für Sie und identifiziert wichtige Marktbereiche, in denen der Preis wahrscheinlich umkehrt oder konsolidiert. Entwickelt für ernsthafte Trader, hilft Ihnen dieses Tool, mit Vertrauen zu handeln, indem es die relevantesten Zonen in Echtzeit hervorhebt.
Hauptmerkmale:
Zusammenfassung
KI-Zusammenfassung
Supply Demand - BasicV1 is an advanced trading indicator designed to automatically identify key supply and demand zones on a single chart timeframe. It highlights high-probability market areas where price is likely to reverse or consolidate, assisting traders in making informed decisions without manual zone drawing. The indicator features automatic detection of strong buy and sell zones, removal of fully broken zones to maintain chart clarity, and filtering of overlapping zones by eliminating weaker ones. Users can also set zones to expire after a specified number of bars, ensuring focus on the most relevant price levels. Additionally, the tool offers customizable visual settings, including zone colors, line styles, thickness, and opacity, allowing integration with various chart styles. This indicator operates in real-time, providing continuous updates to support precise market analysis.
Indikatorprofil
Kundenbewertungen
5.0
Bewertungen: 3
5 | 100 % | |
4 | 0 % | |
3 | 0 % | |
2 | 0 % | |
1 | 0 % |
Kundenbewertungen
September 4, 2025
July 14, 2025
Pros: Clearly marks supply and demand zones. Customizable sensitivity and visual settings. Stable and light on resources. Cons: No alerts or tooltips. Lacks volume-based filtering and setting templates. Needs confirmation for trade signals.
May 6, 2025
Buen Indicador, Marca Zonas importantes ,, facilita la visualizacion y evita la marcacion manual por fallo del operador discrecional
Diskussion
Häufig gestellte Fragen (FAQ)
Über den cTrader Store verfügbare Produkte, einschließlich Handelsbots, Indikatoren und Plugins, werden von externen Entwicklern bereitgestellt und nur zu Informations- und technischen Zugriffszwecken verfügbar gemacht. cTrader Store ist kein Broker und erbringt keine Anlageberatung, persönlichen Empfehlungen oder eine Garantie für zukünftige Performance.


Preis
Seit 14/01/2025
55
Verkäufe
11.36K
Kostenlose Installationen